Analysis GUI
Analysis GUI provides a common interface for the standard PLS_Toolbox and Solo analysis functions, including the exploratory analysis and clustering methods:
and the qualitative regression and classification methods:
The interface allows the flexibility to switch between analysis methods (for a given type of data) and will help you manage your developed models. There are various useful tools integrated into the application that can be accessed through menus and associated GUIs.
Starting Analysis GUI
The Analysis interface can be started from the Workspace Browser (when using Solo or PLS_Toolbox) or from the command line using the command analysis.
- >> analysis
It can also be started with a default analysis method selected by clicking on the particular analysis shortcut in the workspace browser, or by typing the PLS_Toolbox command for the specific analysis of interest without any input arguments. For example, the command below starts the analysis interface preset to the PCA analysis method.
- >> pca
Interface
Main Window (*=right-click context menu):
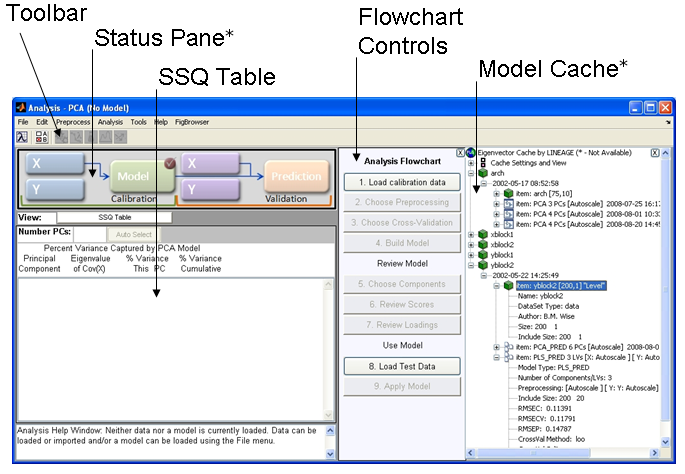
The main Analysis window has a layout with five basic areas.
- Toolbar - The Toolbar contains buttons specific to a particular analysis method.
- Status Pane - The Status Pane shows information for the currently loaded items (hovering the mouse over a particular item will display a temporary window containing specific information). Note that all items in this pane can be clicked on to load or modify the item. In addition, when calibration data is loaded, preprocessing for the given item can be accessed through the "P" icons which appear after the X before the Model icon.
- SSQ Table - For analysis methods that generate statistics, the SSQ window will display statistics and allow you to manipulate the number of components or factors to be modeled. The area directly above the SSQ table contains buttons specific to an analysis allowing you to change information displayed in the SSQ Table area.
- Flowchart - Displays an itemized list of buttons that outline the steps typically needed for the current analysis.
- Model Cache - When turned on, the Model Cache will keep track of and display all of the models, data, and predictions created during the data analysis process.
Menus
Menu items allow access to common I/O functionality, data manipulation, and analysis set-up. Menu items are available both in the main window menubar and as context menus (right-click menus) within the Status Pane and Model Cache. Some menu items are available at all times, others will be disabled depending on the loaded data and model type. Notice that when no DataSet Object or model is loaded, all items except for loading functions are disabled in the menus. As you load data and create models you’ll find appropriate menu items enabled or disabled.
Edit/Options
A number of behaviors and features of the Analysis interface can be modified using the Edit/Options menu. The sub-items provide access to the following options:
Method Options
Controls settings specific to the currently selected analysis method. Typically these options include things like confidence limits settings, algorithm selections, and constraints. Some analysis methods have more settings than others. These options are also accessible through the options button on the Analysis toolbar ![]()
Analysis GUI Options
Controls for the general Analysis GUI are accessed here, including the maximum number of factors available in factor-based models, the default import method used by the Status Pane, whether features like the automatic factor selection are available, and other general display features. The description of these options are given on the options page.
Model Cache Settings
Controls for the Model Cache. See that model cache page and the modelcache function for details on the options available.
Default Plots
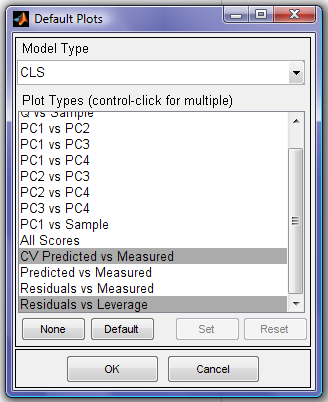
Manage the default scores plots created. This GUI allows selection of which plots should be created when the Scores button is clicked in any of the factor-based analysis methods (PCA, PLS, CLS, etc.) By default, Analysis GUI shows the plots which are considered most useful for the given method. In some cases, you may want to disable or change these defaults based on the kind of data you are working with or the plots you find you use the most.
In this GUI, simply select one of the model types from the provided list, then select which type(s) of plots you want to show with the model type. Keep in mind that not all plots will be available with all model types. Any selection which is invalid will be replaced with a default plot.
To disable automatic plots, click on the None button. To return to the factory-default plots, click the Default button.
When done changing settings for a given model type, click "Set" to save your changes for that model type or "Reset" to discard your changes for that model type. When done changing all settings, click "OK" to save the settings and exit. Clicking "Cancel" at any time will discard all changes made to defaults while the GUI was open.
Window Docking Settings
Controls the general window docking settings. By default Solo and PLS_Toolbox are multi-window-based applications (each control and data figure appears in its own window.) Some users prefer to have all windows appear "docked" inside a single frame (e.g. to allow easier switching between applications.) These options allow the user to choose the general behavior they want. They include the default separate windows for all figures and GUIs; Docking of data figures, but free-floating GUIs; And docking of all data figures and GUIs.
When switching to "all docked" mode, GUIs which are already opened may not be docked until when they are opened again. In all cases, you can force a window to dock by clicking on the small curved arrow in the upper-right-hand corner of any figure or GUI.
Note: This features is not available when using PLS_Toolbox in earlier versions of MATLAB.
Tools
For more information on the special tools in the Tools menu, see the Analysis Tools Menu page.
Help Window
At the bottom of the figure is a Help Window that displays suggestions for the next step of an analysis. It is meant as a guide for novice users and can be turned off by right-clicking on the window.

