ModelBuilding Biplot
Jump to navigation
Jump to search
Scores and Loadings Biplots for a Calibration Model
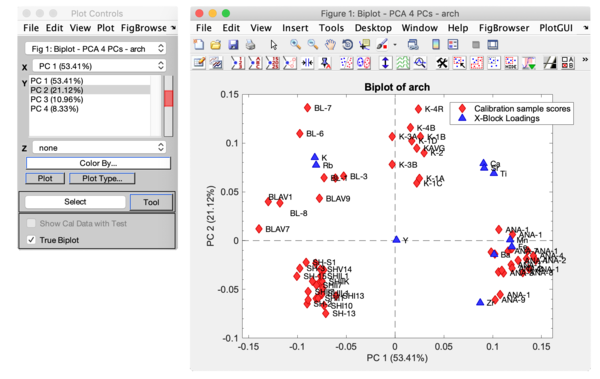
For most analysis methods, the Analysis window toolbar contains a Scores and loadings biplots button ![]() . The Scores and loadings biplots is used to plot the Sample Scores and Variable Loadings on the same plot. The biplot helps identify any trends between the samples and the variables. This plots works best with a small number of variables.
. The Scores and loadings biplots is used to plot the Sample Scores and Variable Loadings on the same plot. The biplot helps identify any trends between the samples and the variables. This plots works best with a small number of variables.
- The figure below shows the biplot for the Arch demo dataset for PC 1 vs PC 2 after removing the unknown samples and building a PCA model with 4 PCs.
The blue triangles show the variable loadings and the red diamonds show the sample scores.
Note: For information about the Plot Controls window and Plot window, see Plot Controls Window.
