Effects Plot
The following describes the Effects Plot for analyzing Design of Experiments results with MLR.
Effects Plot
Usage
Effects plots are used in the evaluation of factorial designs to identify which experimental factors are important, including interactions, and to visually display the magnitude of the effect. Clicking on the 'DOE Effects Plot' menu button will open a window where you select which main effect or interaction effect you wish to view. Selecting an effect and clicking 'OK' opens the Effects Plot. You are also given the opportunity to change the default confidence level value (0.05) used in calculating Fisher's Least Significant Difference (LSD) which is included in the plots.
Interpretation
Main Effects
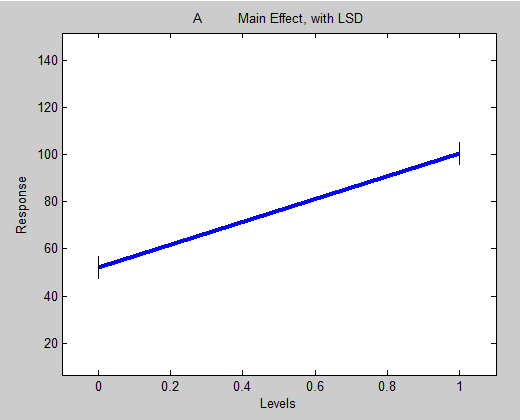
Main Effects plots show how the mean response of a factor varies over the levels investigated for that factor. The levels of this factor are marked on the x-axis. The mean values of all samples studied at the respective levels are plotted on the y-axis. This figure shows the main effect of factor A; the mean response is displayed at 2 levels of A.
The effects plots may also show 'bars' about each plotted point indicating the magnitude of Fisher's LSD. These bars allow for a statistical test for difference between the mean responses of all levels. Data points must be farther apart vertically than the size of the LSD bars to be considered significantly different (at the confidence level used). Also consult the ANOVA table before inferring true significance of a factor.
Interaction Effects
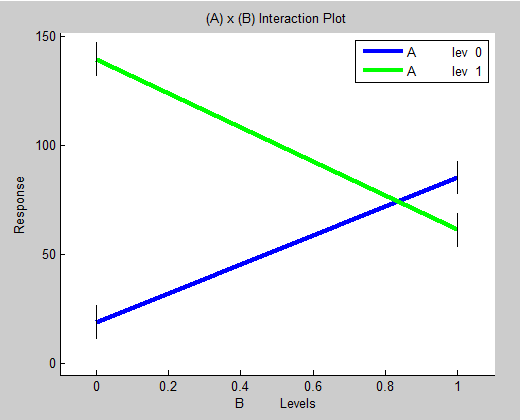
An interaction effect refers to the effect of a second factor on the main effect of a first factor; the response of factor A depends on the setting of factor B. The interaction of factor A and factor B can be presented by showing the main effect of factor A for each level of factor B. If factor B has two levels then there will be two lines plotted, one showing the main effect of factor A when only considering experiments where factor B level is low, and one showing the main effect of factor A when only considering experiments where factor B is high. An interaction effect is significant if there is a change in the main effect of one factor over levels of the second. The figure below shows that there is a significant interaction between factors A and B. The blue line shows the mean response increases with factor A level when factor B level is low while the green line shows that the mean response decreases with factor A level when factor B level is high. Graphically, an interaction is evident as a crossing of the factor A and factor B lines in the interaction plot. An interaction plot where no significant interaction between factors A and B would show 2 parallel lines. Consult the ANOVA table before making a conclusion of whether a significant interaction exists.

