Building an Image Y-block for X-block selection
Building an Image Y-block for X-block selection
This section demonstrates how to create a Y-block image for variable selection using an already loaded image(s) in the X-block in the PLS analysis window. This can be useful for quickly selecting regions of interest in an image.
Creating a new Y-block
- In the Analysis Window select:
File -> New Data -> Calibration/Y-Block
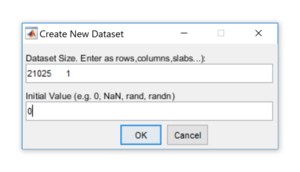
- Set the values for the Y-block (0, NaN, rand…) and click OK.
Folding the Y-block
This will require to open the Edit Data window for Editing the Y-block data, this can be done in two ways:
   1) Edit -> Calibration -> Y-block Data
   OR
   2) Right click on the Y-block and select ‘Edit Data’
- With the Edit Data window open, make sure the ‘Data’ tab is selected and then click:
Transform -> Convert to/from Image
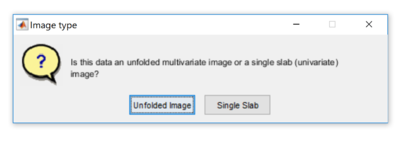
- You will be prompted, select the type of image you wish to unfold it into, select ‘Unfolded Image’.
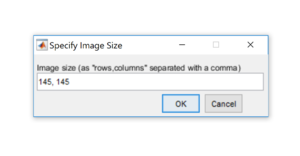
- A small entry box will appear, enter the image sizes.
Hint: Check the X-block’s dimension to selecting the appropriate dimension sizes for folding the Y-block.
- Press ‘OK’ and the Y-block will be folded to the specified dimensions.
Adding values in the Y-block for select X-block regions
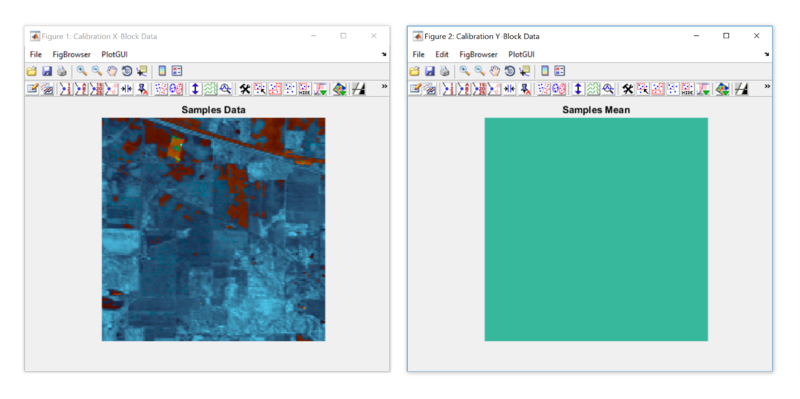
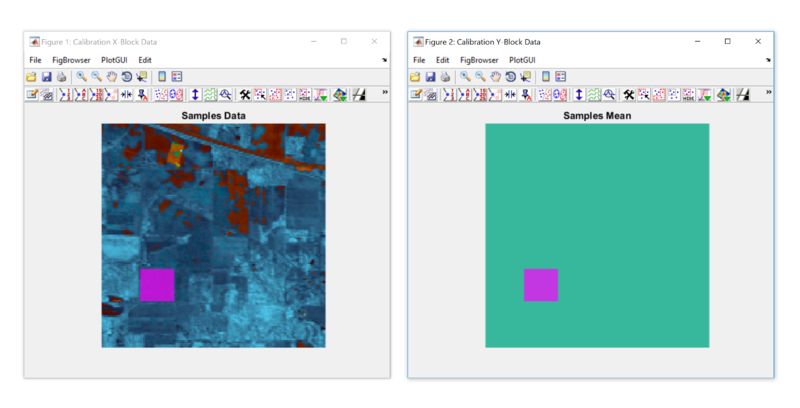
Open plot windows on both the X-block and Y-block datasets. This can be done by one of two ways:
   1) Edit -> Calibration -> Plot X-block Data
   AND
   2) Edit -> Calibration -> Plot Y-block Data

   OR

   1) Right click on the X-block and select ‘Plot Data’
   AND
   2) Right click on the Y-block and select ‘Plot Data’
Note: Make sure in the Plot Controls window, that also pops up, that X is set to 'Samples'.
- If you make a selection of pixels using any one of the selection tools in one of the plots, the selection should also appear in the other. If not, see 'Manual selection of corresponding variables' section below.
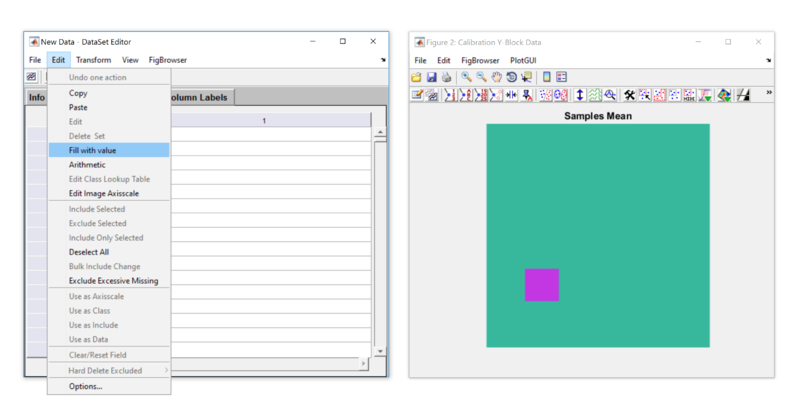
- With variables selected, open the Dataset Editor for the Y-block: In the analysis window, right click the Y-block and select ‘Edit Data’. Then click:
Edit -> Fill with value
- Set the values of the selected Y-block pixels as appropriate in the textbox and press ‘OK’.
You may repeat this process for all regions in the image where you wish to specify the Y values.
Manual selection of corresponding variables
If selecting a region in the X-block doesn’t show up in the Y-block plot automatically, you can set them manually by using the following steps:
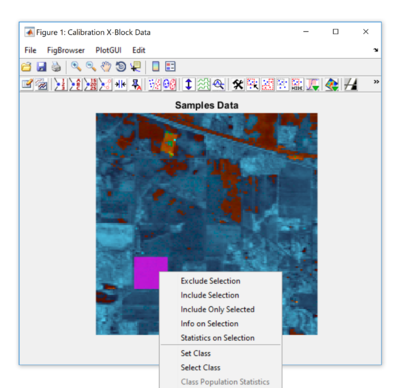
- After selecting a region in the plotted X-block (using the ‘Make Selection’ tool), right click on the image and choose ‘Info on Selection’.
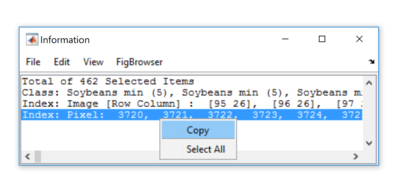
- An information window will appear, the last row is labeled ‘Index: Pixel: ’, right click on it and choose ‘Copy’.
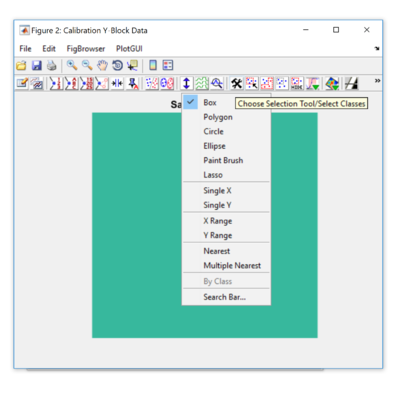
- Next, go to the plotted Y-block window, select ‘Choose Selection Tool/Select Classes’ (the hammer & wrench button) and choose ‘Search Bar…’ from the menu. A search bar will appear below.
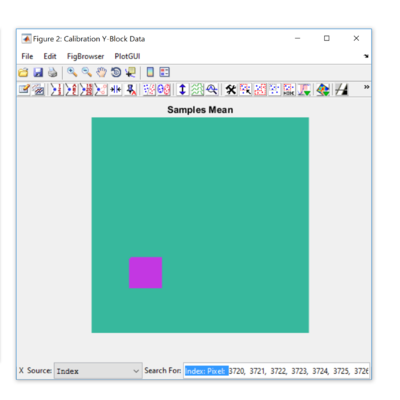
- A search bar will appear in the lower right corner, click on it and press ‘ctrl + v’ to paste select the indexes into it.
- All the corresponding indexes will be selected, except one. To fix this, click on the search bar and press the ‘Home’ button on the keyboard (this will move the cursor to the beginning of the list) and delete the text “Index: Pixel:”. This will allow the first selected index to be parsed correctly making the entire region will be selected.
