Bspcgui
Introduction
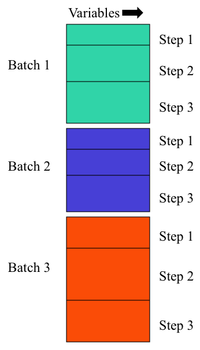
Batch Statistical Process Control (BSPC) is the analysis of process data where the process is subdivided into "batches" (experiments) and may be further subdivided into "Steps" (sub-divisions of batch indicating processing segments or other division of batches). Raw data is presumed to be in a 2 dimensional dataset with Variables as columns.
Model Types
| Model | Modes (Dimensions) | Equal Length Batches | Steps Aligned | Comments |
|---|---|---|---|---|
| Summary PCA | 2 | No | No | Batch x (Step/Summary) |
| Batch Maturity | 2 | No | No | (Batch/Step) x Variable, Can have Y-Block to indicate maturity |
| MPCA | 3 | Yes | Yes | Time (step) x Variable x Batch |
| PARAFAC | 3 | Yes | Yes | Batch x Variable x Time (step) |
| Summary PARAFAC | 3 | No | No | Batch x Step x Summary |
| PARAFAC2 | 3 | No | No | Cell Array of Batches |
See Also: Batch Maturity, MPCA, MSPC, PARAFAC, PARAFAC2
Batch Processor Window
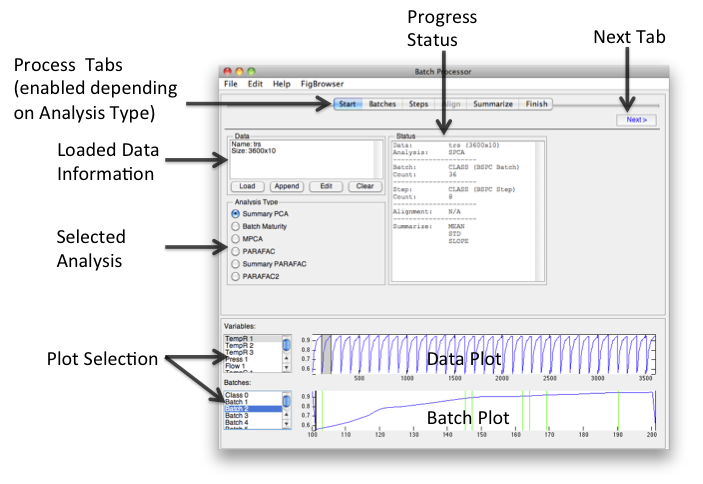
The goal of the Batch Processor interface is to make it easier to assemble “batch” data for multivariate analysis. Because different analyses and conditions require different data manipulation, assembling data for batch analysis can be very difficult and complicated.
The workflow of the interface flows from left to right. Loading data and choosing an Analysis Type will enable relevant tabs. Clicking the Next button will open the next enabled tab. Batches and steps are defined then alignment and summary information is added. When finished, "folded" data can be saved or exported to the analysis interface and or a model for folding new data can be saved.
Start
Load, append, edit, and or clear data. Selecting the Analysis type will automatically enable/disable relevant tabs.
- Dropping data onto the status area will load data. If previously loaded data exists, a prompt for overwrite or augment will appear.
- If augment is chosen, two options will be given, augment as new batch or not. Augment as new batch adds a class for the data being augmented otherwise a "normal" augment will occur and if the new dataset has a matching class it will be merged.
- Dragging and dropping multiple-selected (Excel) files from the system browser (e.g., Windows Explorer or Finder) will pre-augment the files and create a label indicating file name. This label can be used to identify batches in the Batches tab.
- Data can be edited in the DataSet Editor by clicking the Edit button. Editing will cause the model to be cleared.
Batch
Indicate source of Batch information in loaded dataset. Sources can be Class, Label, or Axisscale sets or a single Variable (column). If manually Loaded then a class is created. If the dataset contains a class with the default name of "BSPC Batch" then it will be automatically selected after loading.
- If variable is used, data for that column will be excluded (not deleted) so other mechanisms (preprocessing) can work.
- Once Batches have been identified, one or more batches can be plotted in the lower plot.
Steps
Steps (subdivisions of batches) can be indicated on the Steps tab. Steps can be created in the same manor as Batches or indicated manually.
Manually Selecting Steps
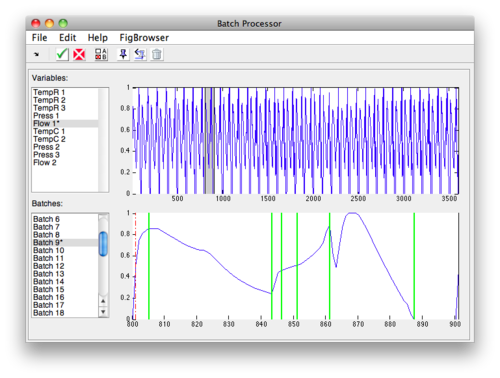
To manually select steps:
- Select the variable and batch to use from the plot list boxes at the bottom of the interface.
- Click the Select button and the interface will switch.
- Click the Add button to place the first step marker.
- Drag this marker to the first step location.
- Repeat until all steps are placed.
- Select different batch from list menu to display "aligned" step position.
- Adjust alignment algorithm as needed using toolbar button.
- Click check-mark button to finish and save steps.
Selected Steps Menu
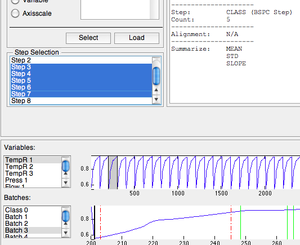
Once steps have been designated, they will appear the Step Selection list. If one or more steps should be ignored they can be deselected in this menu. Selected steps will appear in the batch plot as solid green lines and unselected steps appear as red dashed lines.
Align
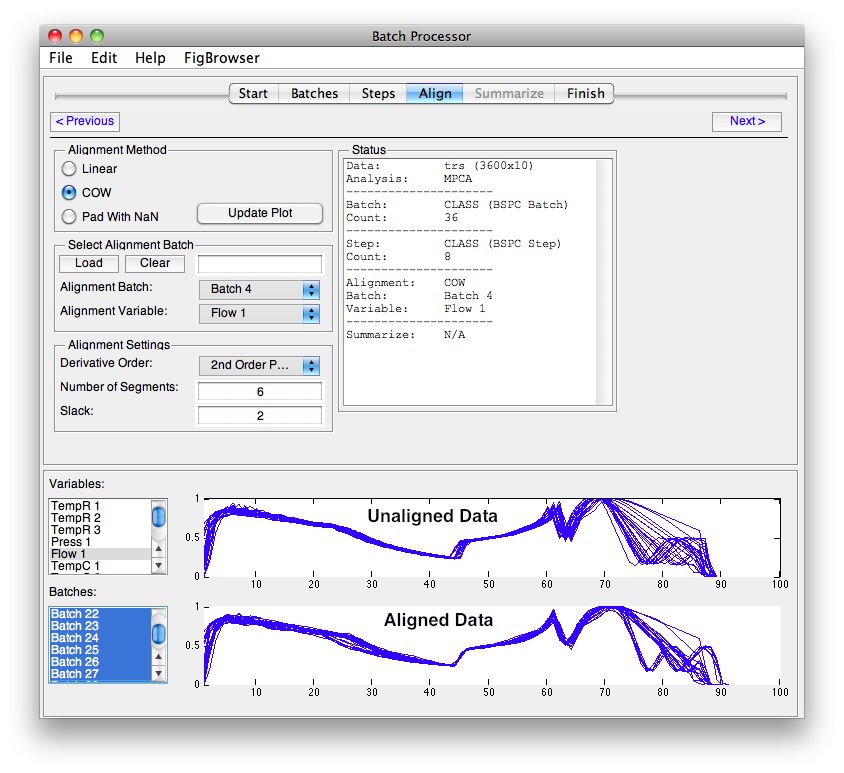
Methods that require equal length batches use the tools available on the Align tab from the batchalign function.
NOTE: In the image above, the alignment batch is Class 0 (the default) which has no members. This must be changed before alignment will work.
- Select the type of alignment.
- Select the Batch and Variable or Load a vector.
- Select COW settings if using COW.
- Click Update Plot to see the results.
Alignment Types:
- Linear - Linear interpolation based on selected variable and batch.
- COW - Correlation Optimized Warping with Alignment Settings values.
- Pad With NaN - Infill with NaN to make equal length.
Plots switch to displaying selected variables and batches pre aligned on top and post align on bottom. Must click Update Plots button to refresh plot.
Summarize
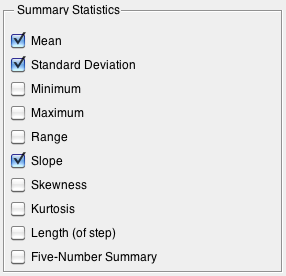
Available summary statistics as calculated by summary function.
All stats summarize each column except for:
- Length Length of steps, single number.
- Five-Number Summary 10, 25, 50, 75, 90th percentile, 5 values per step.
For example with the Dupont demo calibration data (dupont_cal), if you choose mean, std, slope, skewness, and length the size of your folded summary pca data will be:
10 variables x 4 stats + length = 41 values per step * 5 steps = 205 columns
Finish
When completed there are 4 options:
- Send data directly to a new Analaysis window.
- Save the data to the workspace.
- Save a model for future data application. NOTE: In some more complicated instances (loading outside information) the model may not be able to fully capture each step taken in the interface.
- Cancel and close the window.
