Analysis Window: Main Menu
Table of Contents | Previous | Next
The Analysis window main menu is set up in a standard Windows menu format with commands grouped into menus (File, Edit, Preprocess, Analysis, Tools, Help and FigBrowser) across the menu bar. Some of these commands are available in other areas of the application.
- Analysis window main menu
The File menu provides access to loading, importing, saving, and exporting data and models. For more information on these topics see:
The Edit menu provides access to the DataSet Editor for editing and Plot Controls for plotting of the calibration and validation data.
The Edit menu also provides control over various interface and analysis options through the Edit > Options menu:
- Method Options - Opens the Options dialog box which lists options for controlling the settings that are specific to the currently selected analysis method such as confidence limits settings, algorithm selections, and constraints. Some analysis methods have more setting options than others. See Options dialog box.
- Analysis GUI Options - Opens the Options dialog box which lists options for the currently opened Analysis window, including the maximum number of factors displayed, the font size for the Control pane, and the display in the Analysis Flow Chart pane. See Options dialog box.
- Model Cache Settings - Allows you to turn model caching on and off and adjust various other aspects of the model cache. See Analysis window Model Cache pane.
- Default Plots - Opens the Default Plots dialog box in which you can adjusting default Scores plots for given methods.
- Window Docking Settings - Opens the Window Docking Settings dialog box which you use to adjust the docking behavior of your Solo windows. See To specify the Window docking settings.
- Preferences (Expert) - Opens a Preferences (Expert) window which you use to override all values for all Solo options. See Expert Preferences GUI.
The Preprocess menu provides access to the preprocessing window from which you can modify the data pre-treatment being performed on the data. This can be one of the three simple preprocessing methods (None, Mean Centering, or Autoscale) or custom preprocessing.
Once preprocessing has been selected, you can make the current preprocessing the default for the x-block or y-block by selecting the "Use as default" menu item from the x-block or y-block menus, respectively. Preprocessing can also be saved or loaded from a MAT file or the workspace.
The Preprocess menu also provides access to the Clutter functions of Analysis as well as plotting of the preprocessed data.
The Analysis Menu provides access to various analysis methods within the GUI. More details on these methods can be found here
The Tools menu contains a number of tools which you can use to investigate and gather information about the currently loaded data and to assess a model's performance.
- Tools menu
- Cross-Validation - Sets or modifies the settings related to cross-validation of models. See Cross-Validation.
- Orthogonalize Model - Provides orthogonalized PLS and PLSDA models (also known as OPLS and OPLSDA models) in which all y-correlated information compressed in the first component. See Orthogonalizepls.
-
- Show Details - View statistics and model building details for the currently built model.
- Report Writer - Generate an HTML, PowerPoint, or Word Document describing the current model including any plots which are currently open and associated with that model. See Reportwriter.
- Test Model Robustness - Assess model sensitivity to typical interferences. See Test Model Robustness.
- Permutation Test - Performs a y-block reordering and calculates an estimation of the error levels expected for random correlation. See Permutation Test.
- Correlation Map - Shows the degree of correlation among the variables. See Correlation Map.
- Estimate Factor SNR - Provides an estimate of the number of significant PCA factors for the current data using the Estimatefactors algorithm.
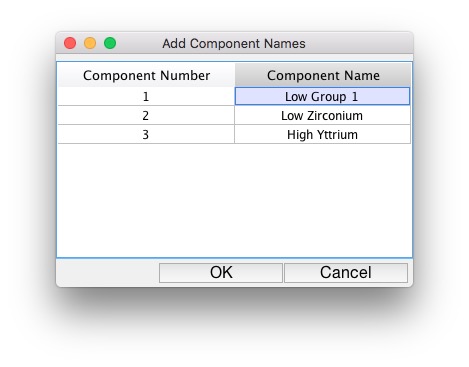
- Add Component Names - Component names can be added after a model is calculated to models of type PCA, MCR, PURITY, and PARAFAC. Recalculating the model will clear component names so it's recommended to name components at the end of the model building process. Component names can be used to help identify components of models in exported models.
-
- View Cache - Changes the model cache viewing options. See Model Cache
- Toolbar - Provides access to all toolbar items via menu controls
