Analysis GUI: Difference between revisions
imported>Jeremy No edit summary |
imported>Jeremy No edit summary |
||
| Line 18: | Line 18: | ||
The interface allows the flexibility to switch between analysis methods (for a given type of data) and will help you manage your developed models. There are various useful tools integrated into the application that can be accessed through menus and associated GUIs. | The interface allows the flexibility to switch between analysis methods (for a given type of data) and will help you manage your developed models. There are various useful tools integrated into the application that can be accessed through menus and associated GUIs. | ||
The Analysis interface can be started from the | The Analysis interface can be started from the [[Workspace Browser]] (when using Solo or PLS_Toolbox) or from the command line using the command <tt>analysis</tt>. | ||
<pre>>> analysis</pre> | <pre>>> analysis</pre> | ||
It can also be started with a default analysis method selected by typing the PLS_Toolbox command for the specific analysis of interest without any input arguments. For example, the command below starts the analysis interface preset to the PCA analysis method. | It can also be started with a default analysis method selected by clicking on the particular analysis shortcut in the workspace browser, or by typing the PLS_Toolbox command for the specific analysis of interest without any input arguments. For example, the command below starts the analysis interface preset to the PCA analysis method. | ||
<pre>>> pca</pre> | <pre>>> pca</pre> | ||
Revision as of 14:01, 7 October 2008
Analysis GUI provides a common interface for the standard PLS_Toolbox and Solo analysis functions, including:
- PCA
- Purity
- MCR
- PARAFAC
- MPCA
- CLUSTER
- PLS
- PCR
- MLR
- CLS
- KNN
- PLSDA
- SIMCA
The interface allows the flexibility to switch between analysis methods (for a given type of data) and will help you manage your developed models. There are various useful tools integrated into the application that can be accessed through menus and associated GUIs.
The Analysis interface can be started from the Workspace Browser (when using Solo or PLS_Toolbox) or from the command line using the command analysis.
>> analysis
It can also be started with a default analysis method selected by clicking on the particular analysis shortcut in the workspace browser, or by typing the PLS_Toolbox command for the specific analysis of interest without any input arguments. For example, the command below starts the analysis interface preset to the PCA analysis method.
>> pca
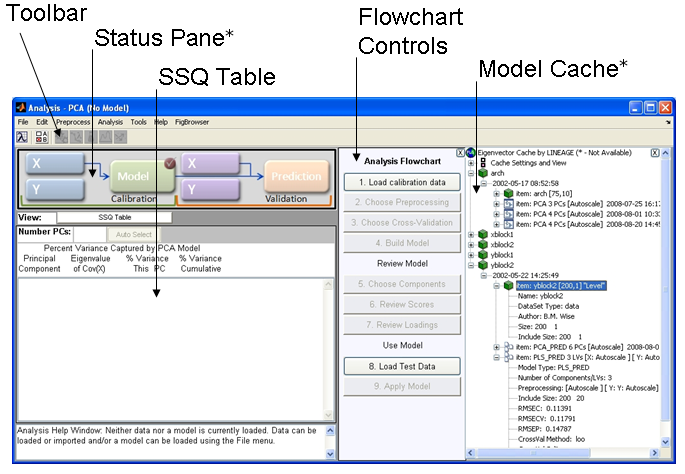
Main Window (*=right-click context menu):
The main Analysis window has a layout with five basic areas.
- Toolbar - The Toolbar contains buttons specific to a particular analysis method.
- Status Pane - The Status Pane shows information for the currently loaded items (hoovering the mouse over a particular item will display a temporary window containing specific information).
- SSQ Table - For analysis methods that generate statistics, the SSQ window will display statistics and allow you to manipulate the number of components or factors to be modeled. The area directly above the SSQ table contians buttons specific to an analysis allowing you to change information displayed in the SSQ Table area.
- Flowchart - Displays an itemized list of buttons that outline the steps typically needed for the current analysis.
- Model Cache - When turned on, the Model Cache will keep track of and display all of the models, data, and predictions created during the data analysis process.
Menu items allow access to common I/O functionality, data manipulation, and analysis set-up. Menu items are available both in the main window menubar and as context menus (right-click menus) within the Status Pane and Model Cache. Some menu items are available at all times, others will be disabled depending on the loaded data and model type. Notice that when no DataSet Object or model is loaded, all items except for loading functions are disabled in the menus. As you load data and create models you’ll find appropriate menu items enabled or disabled.
At the bottom of the figure is a Help Window that displays suggestions for the next step of an analysis. It is meant as a guide for novice users and can be turned off by right-clicking on the window.
