Tools ModelRobustness: Difference between revisions
imported>Jeremy No edit summary |
imported>Jeremy No edit summary |
||
| Line 20: | Line 20: | ||
Consider the figure above, which shows the model robustness for a regression model with an RMSEC (Root Mean Squared Error of Calibration) of approximately 0.5. As shown in this figure: | Consider the figure above, which shows the model robustness for a regression model with an RMSEC (Root Mean Squared Error of Calibration) of approximately 0.5. As shown in this figure: | ||
{| | {| | ||
|- | |- | ||
| Line 29: | Line 29: | ||
|} | |} | ||
{| | {| | ||
|- | |- | ||
| Line 38: | Line 38: | ||
|} | |} | ||
{| | {| | ||
|- | |- | ||
| Line 64: | Line 64: | ||
Consider the figure above, which shows the model robustness for a regression model with an RMSEC (Root Mean Squared Error of Calibration) of approximately 0.5. As shown in this figure, the RMSEP for the model can be impacted in one of three ways: | Consider the figure above, which shows the model robustness for a regression model with an RMSEC (Root Mean Squared Error of Calibration) of approximately 0.5. As shown in this figure, the RMSEP for the model can be impacted in one of three ways: | ||
{| | {| | ||
|- | |- | ||
| Line 73: | Line 73: | ||
|} | |} | ||
{| | {| | ||
|- | |- | ||
| Line 82: | Line 82: | ||
|} | |} | ||
{| | {| | ||
|- | |- | ||
Revision as of 12:37, 29 July 2010
Table of Contents | Previous | Next
Model Robustness Tool
You use the Model Robustness tool to measure the sensitivity of a regression model to artifacts in new spectroscopic measurements. To open the Model Robustness tool, on the Analysis window, click Tools > Model Robustness, and then click Shifts or Interferences.
Shifts
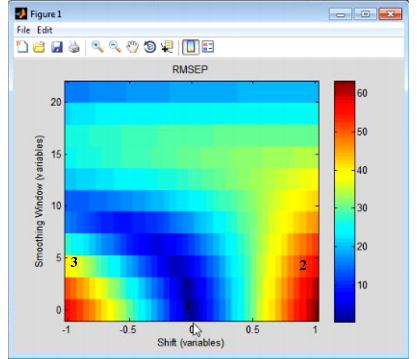
The Shifts option measures the sensitivity of a regression model to shifts in x-axis data that are caused by instrument instability-that is, if you have an instrument that is not particularly stable or reproducible over time, what is the impact on predictions using the given model? The Shifts plot is a three-dimensional plot that details the RMSEP (Root Mean Squared Error of Prediction) for the model as a function of shift, where shift is described in terms of the number of variables and the Smoothing window.
- Example of a Shifts plot
Consider the figure above, which shows the model robustness for a regression model with an RMSEC (Root Mean Squared Error of Calibration) of approximately 0.5. As shown in this figure:
|
|
|
Interferences
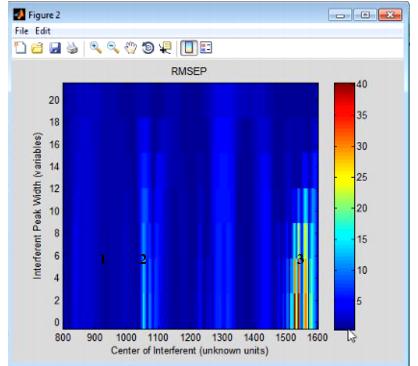
The Interferences option measures the sensitivity of a regression model to the location and width of a new peak in test data-that is, if you have a chemical entity that is present in the test data but that was not reflected in the calibration data, what is the impact on predictions using the given model? The Interferences plot is a three-dimensional plot that details the RMSEP (Root Mean Squared Error of Prediction) for the model as a function of a new peak, where the peak is described in terms of its width and location.
- Example of an Interferences plot
Consider the figure above, which shows the model robustness for a regression model with an RMSEC (Root Mean Squared Error of Calibration) of approximately 0.5. As shown in this figure, the RMSEP for the model can be impacted in one of three ways:
|
|
|

