Analysis Window: Main Menu: Difference between revisions
imported>Jeremy No edit summary |
imported>Jeremy No edit summary |
||
| Line 6: | Line 6: | ||
The Analysis window main menu is set up in a standard Windows menu format with commands grouped into menus (File, Edit, View, Analyze, Help and FigBrowser) across the menu bar. Some of these commands are available in other areas of the application. | The Analysis window main menu is set up in a standard Windows menu format with commands grouped into menus (File, Edit, View, Analyze, Help and FigBrowser) across the menu bar. Some of these commands are available in other areas of the application. | ||
:''Analysis window main menu'' | |||
::[[Image:Analysis_window_main_menu.png|296x20px]] | ::[[Image:Analysis_window_main_menu.png|296x20px]] | ||
| Line 17: | Line 17: | ||
{| | {| | ||
|- | |- valign="top" | ||
| | | | ||
| Line 26: | Line 26: | ||
{| | {| | ||
|- | |- valign="top" | ||
| | | | ||
| Line 35: | Line 35: | ||
{| | {| | ||
|- | |- valign="top" | ||
| | | | ||
| Line 44: | Line 44: | ||
{| | {| | ||
|- | |- valign="top" | ||
| | | | ||
| Line 53: | Line 53: | ||
{| | {| | ||
|- | |- valign="top" | ||
| | | | ||
| Line 62: | Line 62: | ||
{| | {| | ||
|- | |- valign="top" | ||
| | | | ||
| Line 75: | Line 75: | ||
{| | {| | ||
|- | |- valign="top" | ||
|1. | |1. | ||
| Line 85: | Line 85: | ||
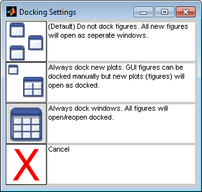
:The Docking Settings dialog box opens. The first docking setting (All data figures and interfaces open as separate windows) is selected by default. | :The Docking Settings dialog box opens. The first docking setting (All data figures and interfaces open as separate windows) is selected by default. | ||
:''Docking Settings dialog box'' | |||
::[[Image:Docking_Settings_dialog_box.png|202x192px]] | ::[[Image:Docking_Settings_dialog_box.png|202x192px]] | ||
| Line 95: | Line 95: | ||
{| | {| | ||
|- | |- valign="top" | ||
|2. | |2. | ||
| Line 109: | Line 109: | ||
The Tools menu contains a number of tools which you can use to investigate and gather information about the currently loaded data and to assess a model's performance. | The Tools menu contains a number of tools which you can use to investigate and gather information about the currently loaded data and to assess a model's performance. | ||
:''Tools menu'' | |||
::[[Image:Tools_menu.png|167x170px]] | ::[[Image:Tools_menu.png|167x170px]] | ||
| Line 121: | Line 121: | ||
{| | {| | ||
|- | |- valign="top" | ||
| | | | ||
| Line 130: | Line 130: | ||
{| | {| | ||
|- | |- valign="top" | ||
| | | | ||
| Line 139: | Line 139: | ||
{| | {| | ||
|- | |- valign="top" | ||
| | | | ||
Revision as of 13:08, 29 July 2010
Table of Contents | Previous | Next
The Analysis window main menu is set up in a standard Windows menu format with commands grouped into menus (File, Edit, View, Analyze, Help and FigBrowser) across the menu bar. Some of these commands are available in other areas of the application.
- Analysis window main menu
The Edit > Options menu contains the following options:
|
|
|
|
|
|
To specify the Window docking settings
By default, when you first open Solo, every data figure and interface in Solo is a floating window, which is a window that you can drag to any position on your desktop. You can also resize a floating window. You can select different Window docking settings to change the floating behavior of data figures, interfaces, or both.
| 1. | On an Analysis window main menu, click Edit > Options > Window Docking Settings. |
- The Docking Settings dialog box opens. The first docking setting (All data figures and interfaces open as separate windows) is selected by default.
- Docking Settings dialog box
| 2. | To select a different Window docking setting, click the setting. |
- The Docking Settings dialog box closes and you return to the Analysis window. The new docking setting is effective after you close and re-open a window.
The Tools menu contains a number of tools which you can use to investigate and gather information about the currently loaded data and to assess a model's performance.
- Tools menu
See:

