Analysis Window: Layout: Difference between revisions
Jump to navigation
Jump to search
imported>Jeremy No edit summary |
imported>Jeremy No edit summary |
||
| Line 8: | Line 8: | ||
{| | {| | ||
|- | |- valign="top" | ||
| | | | ||
| Line 17: | Line 17: | ||
{| | {| | ||
|- | |- valign="top" | ||
| | | | ||
| Line 26: | Line 26: | ||
{| | {| | ||
|- | |- valign="top" | ||
| | | | ||
| Line 35: | Line 35: | ||
{| | {| | ||
|- | |- valign="top" | ||
| | | | ||
| Line 44: | Line 44: | ||
{| | {| | ||
|- | |- valign="top" | ||
| | | | ||
| Line 53: | Line 53: | ||
{| | {| | ||
|- | |- valign="top" | ||
| | | | ||
| Line 62: | Line 62: | ||
{| | {| | ||
|- | |- valign="top" | ||
| | | | ||
| Line 69: | Line 69: | ||
|} | |} | ||
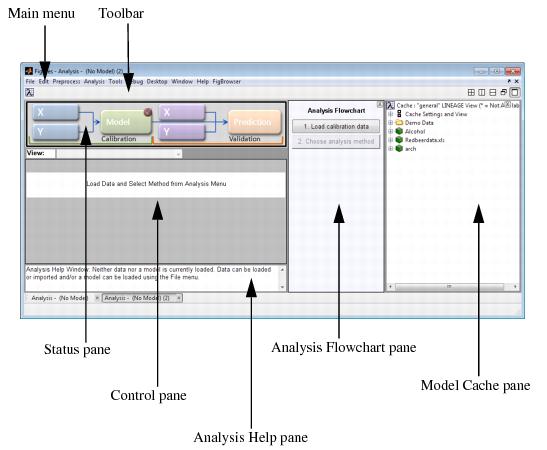
:''Analysis window layout'' | |||
::[[Image:AnalysisWindow_Layout.13.1.1.jpg|547x450px]] | ::[[Image:AnalysisWindow_Layout.13.1.1.jpg|547x450px]] | ||
Revision as of 13:08, 29 July 2010
Table of Contents | Previous | Next
Analysis Window
The Analysis window serves as the core interface to the Solo data modeling and analysis functions. You create your models in an Analysis window, apply models in this window, and also analyze and explore the models in this window. The Analysis window has seven major components. These components are the:
- Analysis window layout
