Analysis Window: Status Pane
Table of Contents | Previous | Next
Analysis window Status pane
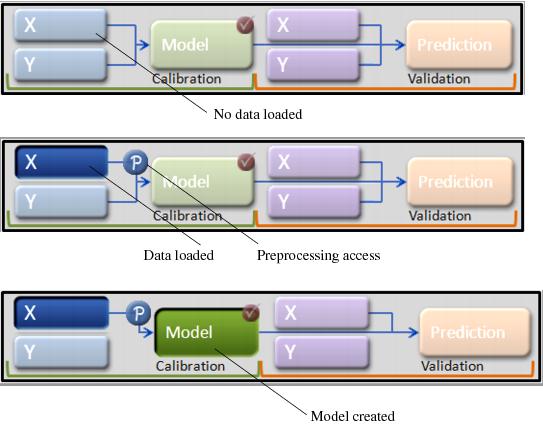
The Status pane is both informational and interactive. The appearance of the pane visually indicates the status of the analysis. It has an initial appearance before you load data into the Analysis window, it has a different appearance after you load data into the Analysis window, and it has yet another appearance after you create an item from the loaded data. For example, as shown in the figure below, the X calibration control (the primary location for loading data in an Analysis window) changes appearance after you load calibration data. In addition, a "P" appears after the X control and before the Model control, which you can use to access preprocessing methods for the loaded data. After you create a model based on the loaded data, the Status pane has yet another appearance.
- Different appearances of the Status pane
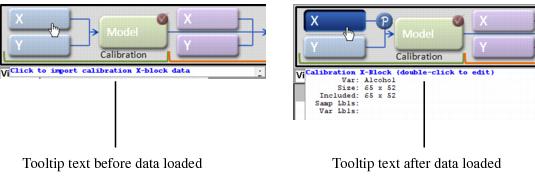
In addition, just as the appearance of the pane varies based on the analysis status, the information that is displayed for a control varies based on the analysis status. For example, before you start an analysis, place your mouse pointer the on the X calibration control to view instructions about working with the control. After you load data, place your mouse pointer on the control again to view not only information about the loaded data, but also, different instructions about working with the control.
- Information that is displayed in the Status pane
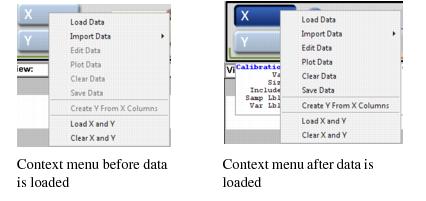
Every control in the Status pane is both left-clickable and right-clickable. What happens after you click on a control depends not only on the control itself (is it an X or Y control or is it a Model or Prediction control), but also, on the type of click (left or right) and the analysis status. For example, if you left click an empty X calibration control, then the Import dialog box opens, and you must select a file to import. If you left click or right click the X calibration control after you have loaded data, then a menu opens with options for manipulating (loading, importing, editing, plotting, and so on) the data. Again, as shown in the figure below, the options that are enabled on the menu depend on the analysis status.
- Status pane context menu
Note: All of the actions that are available in the Status pane are also accessible through the Analysis window menus and toolbar, but it is typically easier to work directly in the Status pane.


