Solo Windows: Difference between revisions

From Eigenvector Research Documentation Wiki
Jump to navigation Jump to search
imported>Jeremy
No edit summary
imported>Jeremy
No edit summary
Line 1: Line 1:
__TOC__
[[TableOfContents|Table of Contents]] | [[Solo_Launch|Previous]] | [[Solo_CommonApplicationFeatures|Next]]
[[TableOfContents|Table of Contents]] | [[Solo_Launch|Previous]] | [[Solo_CommonApplicationFeatures|Next]]


Revision as of 16:24, 29 July 2010

Table of Contents | Previous | Next

Solo Windows

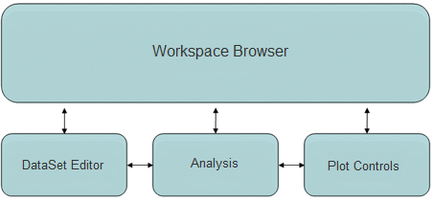
Solo is organized around four primary windows-the Workspace Browser window, the DataSet Editor window, the Analysis window, and the Plot Controls window. Each window provides functions that are dedicated to a specific step in the data analysis process.

Solo windows
Solo Environment.png
  • Workspace Browser window-The Workspace Browser is your starting interface for Solo. The interface provides quick access to all of the data analysis tools. The browser also serves as your "scratch pad" in Solo-you can pre-process data for analysis in the browser, or you can import data into the browser and then manipulate the data prior to analysis. See Workspace Browser.
  • DataSet Editor window-The Dataset Editor window is the primary data handling window in Solo. It provides a variety of functions and tools for loading, editing, and saving data. See DataSet Editor Window.
  • Analysis window-The Analysis window serves as the core interface to the Solo data modeling and analysis functions. You create your models in an Analysis window, analyze and explore the models in this window, and also apply models in this window. See Analysis Window.
  • Plot Controls window-The Plot Controls window is the principal data visualization tool for Solo. It provides an extensive number of tools for labeling, manipulating, and publishing plots that you generate in Solo. See Plot Controls Window.

Any window in Solo can be a floating window or it can be docked. You can specify Window docking settings either through options in the Workspace Browser or through options in an Analysis window. See Workspace Browser Preferences or Analysis window main menu.