Sample Classification Predictions: Difference between revisions
imported>Donal |
imported>Jeremy No edit summary |
||
| Line 1: | Line 1: | ||
==Classification Information in Scores Plot== | ==Classification Information in Scores Plot== | ||
Viewing classification results for samples can be done in a scores plot of a PLSDA, SVMDA, KNN or SIMCA model. If the model has been applied to test data, predictions will also be available for those samples. The predictions for the calibration data are "self-predictions" (predictions for the model on the calibration data itself.) | |||
All of these analysis methods determine the probability that a sample belongs to each possible classes. Based on this, the user can view plots or the table of results showing various classification information based on one or more different rules including the following. These rules are described in detail after the list. | |||
Based on this the user can view plots | |||
* '''Class Pred Strict''' - Numerical class assignment based on strict class assignment rules. | |||
* '''Class Pred Most Probable''' - Numerical class assignment based on most probable class rules. | |||
* '''Class Pred Probability <ClassID>''' - Probability that the sample belongs to a specific class <ClassID>. | |||
* '''Class Pred Member <ClassID>''' - Logical (true/false) class assignment to a specific class <ClassID> based on strict multiple-class assignment rules. | |||
* '''Class Pred Member - Unassigned''' - Logical (true/false) class assignment indicating when no class could be assigned to a sample. | |||
* '''Misclassified''' - Logical (true/false) indicating when the strict classification does not match the known "measured" class assignment. | |||
Results can be viewed as a plot by using the "Plot Controls" window for the scores plot. For example, setting the Plot Controls Y field to "Class Pred Most Probable" will show the most probable class for each sample in the Scores Plot. This is displayed as the numerical class number (for reference, this is the same number viewable in the class lookup table, if the model was built from a DataSet with classes.) When selected, the Y axis ranges over all possible class numbers and a sample determined to belong to class = 2 would be shown at (x,y) = (sample number, 2). | |||
the | |||
Results can also be viewed as a table by selecting File > Edit Data from the plot controls (or use the Edit Data toolbar button on the scores plot itself.) | |||
===Class Pred Strict=== | |||
These | Strict class predictions are based on the rule that each sample belongs to a class if the probability is > 0.50 for one and only one class. If no class has a probability > 0.50 or if more than one class has a probability > 0.50, then the sample is assigned to class zero (0) indicating no class could be assigned. These predictions provide the most safety in class assignment. If there is too large an uncertainty of a sample being a member of a class, or if the sample appears to be in more than one class, this field will indicate that. If samples are expected to belong to more than one class, use the '''Class Pred Member''' predictions (described below.) | ||
Use strict class predictions if you need to see a class assignment for each sample where the model is confident the sample belongs to this class and to this class only. | |||
===Class Pred Most Probable=== | |||
Most probable predictions are based on choosing the class that has the highest probability regardless of the absolute value of that probability. Note this differs from Strict class predictions because if more than one class has > 0.50 probability, the highest probability will "win" the sample. Likewise, if all probabilities are below 0.50, the largest probability still "wins". | |||
Use these predictions if you need to see a single class assignment for each sample and are not concerned with the absolute probability of the classes. This might be the case when a model has been built on only a few example samples for each class, when samples have been pre-screened as being in one of the classes modeled, or when "no class" has no meaning. | |||
There is always a most likely class for a sample to belong to but it is possible that the sample is not well modeled and has low probabilities for all classes. Or it is possible that two classes are similar and a sample belonging to one of them will also have a high predicted probability of belonging to the second class. In these situations it may be more useful to use the Strict class predictions. | |||
===Class Pred Probability <ClassID>=== | |||
The predicted probability that a sample belongs to a particular class is a method-dependent calculation, but in general is calculated such that a sample belonging to this class will have value closer to 1. Otherwise, it will be closer to 0. There will be a separate probability calculated for each class, and the class will be named in the field. For example the class named <ClassID>, is available under the label "Class Pred Probability <ClassID>". | |||
These predictions are useful when you need to report a confidence of assignment or need to derive special rules for class assignment. | |||
===Class Pred Member <ClassID>=== | |||
Class member predictions are reported as true/false for each class (<ClassID>) and are similar to the strict class predictions described earlier. A sample will be indicated as a member of a class if and only if the predicted probability for the given class is > 0.50. However, there is no restriction that a sample be assigned to one and only one class. As a result, a sample may be a member of more than one class if each class's probability is > 0.50. | |||
These predictions should be used when an analysis permits a sample to belong to more than one class, or to no classes. That is, when the classes being predicted are not exclusionary for each other. For example, a model that reports both the water solubility of a compound (is or is not water soluble), and whether or not that compound is organic (organic vs. inorganic) should allow all combinations of both organic/inorganic and soluble/insoluble without exclusion. | |||
The predictions for "Class Pred Member - unassigned" identify samples which were not assigned to any class because no predicted probability | |||
was greater than 0.5. | was greater than 0.5. | ||
===Misclassified=== | |||
For SIMCA and PLSDA the actual class | Misclassified predictions identify samples where the predicted "Class Pred Strict" does not agree with the sample's actual class. | ||
could include more than one class and the sample is misclassified if its "Class Pred Member <ClassID>" do not correctly predict the actual class(es). | For SIMCA and PLSDA the actual class could include more than one class and the sample is misclassified if its "Class Pred Member <ClassID>" do not correctly predict the actual class(es). If the sample's actual class is unknown then the sample will not be identified as as misclassified. | ||
If the sample's actual class is unknown then the sample will not be identified as as misclassified. | |||
==Example of Classification Information in Scores Plot== | ==Example of Classification Information in Scores Plot== | ||
Revision as of 10:18, 30 September 2011
Classification Information in Scores Plot
Viewing classification results for samples can be done in a scores plot of a PLSDA, SVMDA, KNN or SIMCA model. If the model has been applied to test data, predictions will also be available for those samples. The predictions for the calibration data are "self-predictions" (predictions for the model on the calibration data itself.)
All of these analysis methods determine the probability that a sample belongs to each possible classes. Based on this, the user can view plots or the table of results showing various classification information based on one or more different rules including the following. These rules are described in detail after the list.
- Class Pred Strict - Numerical class assignment based on strict class assignment rules.
- Class Pred Most Probable - Numerical class assignment based on most probable class rules.
- Class Pred Probability <ClassID> - Probability that the sample belongs to a specific class <ClassID>.
- Class Pred Member <ClassID> - Logical (true/false) class assignment to a specific class <ClassID> based on strict multiple-class assignment rules.
- Class Pred Member - Unassigned - Logical (true/false) class assignment indicating when no class could be assigned to a sample.
- Misclassified - Logical (true/false) indicating when the strict classification does not match the known "measured" class assignment.
Results can be viewed as a plot by using the "Plot Controls" window for the scores plot. For example, setting the Plot Controls Y field to "Class Pred Most Probable" will show the most probable class for each sample in the Scores Plot. This is displayed as the numerical class number (for reference, this is the same number viewable in the class lookup table, if the model was built from a DataSet with classes.) When selected, the Y axis ranges over all possible class numbers and a sample determined to belong to class = 2 would be shown at (x,y) = (sample number, 2).
Results can also be viewed as a table by selecting File > Edit Data from the plot controls (or use the Edit Data toolbar button on the scores plot itself.)
Class Pred Strict
Strict class predictions are based on the rule that each sample belongs to a class if the probability is > 0.50 for one and only one class. If no class has a probability > 0.50 or if more than one class has a probability > 0.50, then the sample is assigned to class zero (0) indicating no class could be assigned. These predictions provide the most safety in class assignment. If there is too large an uncertainty of a sample being a member of a class, or if the sample appears to be in more than one class, this field will indicate that. If samples are expected to belong to more than one class, use the Class Pred Member predictions (described below.)
Use strict class predictions if you need to see a class assignment for each sample where the model is confident the sample belongs to this class and to this class only.
Class Pred Most Probable
Most probable predictions are based on choosing the class that has the highest probability regardless of the absolute value of that probability. Note this differs from Strict class predictions because if more than one class has > 0.50 probability, the highest probability will "win" the sample. Likewise, if all probabilities are below 0.50, the largest probability still "wins".
Use these predictions if you need to see a single class assignment for each sample and are not concerned with the absolute probability of the classes. This might be the case when a model has been built on only a few example samples for each class, when samples have been pre-screened as being in one of the classes modeled, or when "no class" has no meaning.
There is always a most likely class for a sample to belong to but it is possible that the sample is not well modeled and has low probabilities for all classes. Or it is possible that two classes are similar and a sample belonging to one of them will also have a high predicted probability of belonging to the second class. In these situations it may be more useful to use the Strict class predictions.
Class Pred Probability <ClassID>
The predicted probability that a sample belongs to a particular class is a method-dependent calculation, but in general is calculated such that a sample belonging to this class will have value closer to 1. Otherwise, it will be closer to 0. There will be a separate probability calculated for each class, and the class will be named in the field. For example the class named <ClassID>, is available under the label "Class Pred Probability <ClassID>".
These predictions are useful when you need to report a confidence of assignment or need to derive special rules for class assignment.
Class Pred Member <ClassID>
Class member predictions are reported as true/false for each class (<ClassID>) and are similar to the strict class predictions described earlier. A sample will be indicated as a member of a class if and only if the predicted probability for the given class is > 0.50. However, there is no restriction that a sample be assigned to one and only one class. As a result, a sample may be a member of more than one class if each class's probability is > 0.50.
These predictions should be used when an analysis permits a sample to belong to more than one class, or to no classes. That is, when the classes being predicted are not exclusionary for each other. For example, a model that reports both the water solubility of a compound (is or is not water soluble), and whether or not that compound is organic (organic vs. inorganic) should allow all combinations of both organic/inorganic and soluble/insoluble without exclusion.
The predictions for "Class Pred Member - unassigned" identify samples which were not assigned to any class because no predicted probability was greater than 0.5.
Misclassified
Misclassified predictions identify samples where the predicted "Class Pred Strict" does not agree with the sample's actual class. For SIMCA and PLSDA the actual class could include more than one class and the sample is misclassified if its "Class Pred Member <ClassID>" do not correctly predict the actual class(es). If the sample's actual class is unknown then the sample will not be identified as as misclassified.
Example of Classification Information in Scores Plot
Shown below is an example Scores Plot from PLSDA run on the arch dataset. In the Plot Controls window (on left) are shown some of the classification fields which may be plotted. The X field is set to "Sample" and the Y field is set to "Misclassified". The Scores Plot shows that all X samples have value 0 (NOT misclassified) except for one sample, the 16th, which has value 1, indicating it is misclassified. Looking at the "Class Pred Most Probable" field shows this sample is correctly predicted as belonging to class 2 ("BL"). Looking at "Class Member Pred K" and "Class Member Pred BL" both show sample 16 belonging, meaning that sample 16 belongs to each of these classes with probability > 0.5. Sample 16 actually only belongs to class "BL", however, as shown by Y="Class Measured 2 (BL)", and therefore it is considered to be misclassified. Note that none of the unknown class samples (samples 64-75) marked as misclassified.
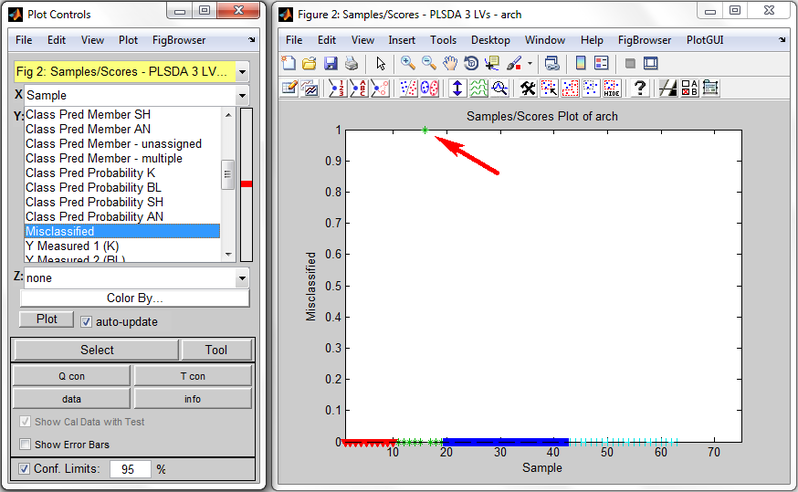
Scores Plot (right) and its Plot Controls (left) for PLSDA on arch dataset.
