Key GUIs
Most of the higher-level data analysis tools can be accessed through Graphical User Interfaces (GUIs) in PLS_Toolbox. In many cases a GUI can make data analysis faster and easier to perform and interpret than using the command line analogs.
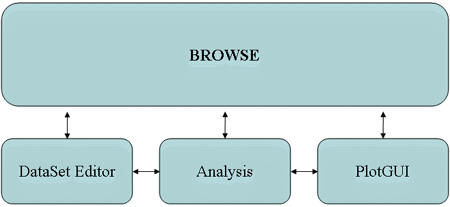
PLS_Toolbox is organized around 4 main GUI tools. Each tool is dedicated to a specific step in the data analysis process.
- The Browse GUI is the PLS_Toolbox "desktop" environment. Here one has access to all loaded data, available analysis methods, the DataSet Editor, and other top level tools. With its "drag and drop" functionality, a user can quickly begin a number of data analysis tasks.
- The DataSet Editor is the primary data-handling GUI in PLS_Toolbox. It provides a variety of functions and tools for loading, editing, and saving data. As its name suggests, the object used in PLS_Toolbox for managing data is the DataSet Object.
- The Analysis GUI is the core interface with PLS_Toolbox data modeling and exploration functions. This is where you will create and explore your models.
- The PlotGUI interface is the principal data visualization tool for PLS_Toolbox. It provides a vast number of tools for labeling, manipulating, and publishing plots generated using PLS_Toolbox.
Browse GUI
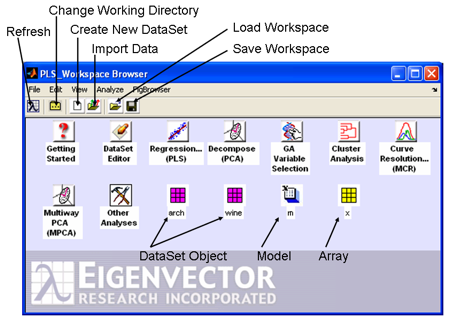
The Browse window shows icons for tools and objects in the PLS_Toolbox workspace. Each analysis icon opens its respective interface in the named mode (e. g., Decompose will open the Analysis window with PCA already selected). The browse environment is "drag and drop" enabled so you can click on a DataSet icon, drag it over an analysis icon, and release the click to start the analysis. This will open the Analysis window with the method pre-selected and load the data. Likewise, you can drag an existing data or model icon from the browse window over to an Analysis window and "drop" the data /model into an ongoing analysis.
Managing Windows In PLS_Toolbox and Solo
Managing numerous windows can be challenging, especially when you have limited screen space. PLS_Toolbox/Solo provides several tools for helping with this problem.
The figbrowser utility (short for "Figure Browser") is available as a menu item at the top of all open figures.
Although the FigBrowser utility can help you manage figures (see below), you can also set the Browser to display figures using setplspref (see setplspref and getplspref in the manual for more information) from the command line using the following command: >> setplspref('browse', 'viewfigures', 'true') Once you’ve set the preferences, you’ll have to restart the Browser for the new preferences to take affect.

