Review SIMCA Model Results
Modeled Classes
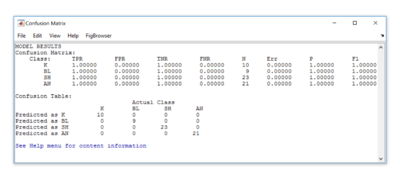
When a SIMCA model is constructed, the analysis window summarizes the number of samples modeled in each class. Clicking on the ‘Plot Scores & Sample Statistics’ (purple Erlenmeyer flask button) will open a plot & plot controls windows to display the results. The ‘Show Confusion Matrix and Table’ (the button displaying a table), will display the model details.
Confusion Matrix
The confusion matrix provides a summary of the SIMCA model analogues to model information window for a PCA model, it includes two tables: The Confusion Matrix, and the Confusion Table.
Update Model
Any sub-model can be reloaded into the analysis window by selecting it in the Modeled Classes list in the SIMCA Model Builder window. Once loaded, it can be modified and added to the Modeled Classes list.
Note: Any sub-model that is modified and added back to the Modeled Classes list will be added as a new model, i.e. it will not overwrite the old model. Also any modifications to the Modeled Classes list will result in deleting the SIMCA model, i.e. it will need to be rebuild.
Review results
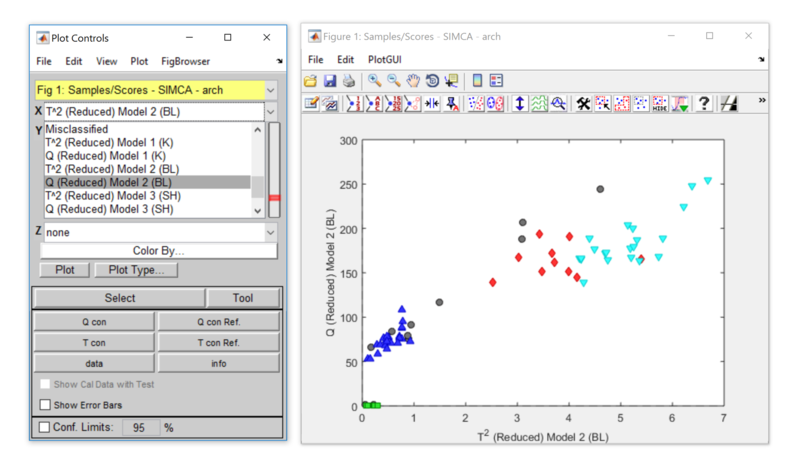
Each sample’s class is predicted based on its Q residuals, T^2, or both, depending on the selected rule in the SIMCA options window. You may consult with each sub-model’s respective T^2 vs Q residuals to see why a sample is predicted belongs to a class or several classes compared to other classes as well as provide guidance to help refine the model’s settings.
Note: Each sample is colored based on its designated class. Samples without a class are colored gray by default.
Class Pred Member
These figures represent the SIMCA model’s prediction, i.e. of which samples are predicted to be members of the selected class (Boolean).
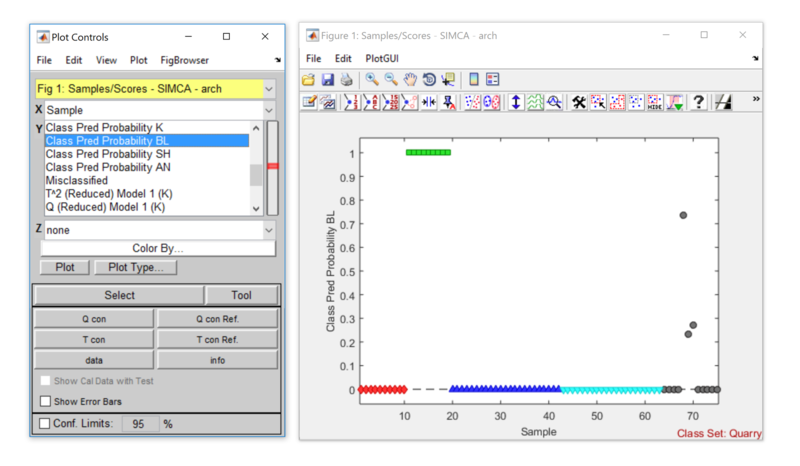
Class Pred Probablilty
Similar to the Class Pred Member figures, these results are on a scale of 0 to 1 (0%-100%, respectively). The closer a sample’s value is to 1, the more probable it is a member of the selected class.
Class Pred Strict
Summarizes the predicted classes for the samples. In strict, a sample’s class is selected as the one (and only) class with the highest probability above a threshold (default is 0.5).
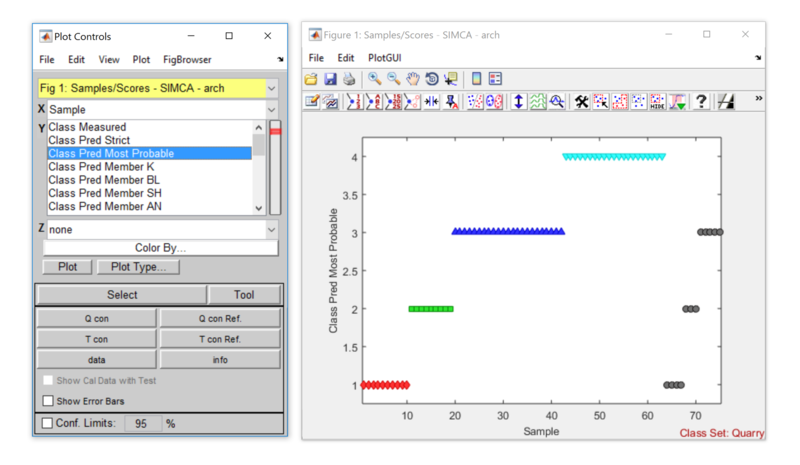
Class Pred Most Probable
Similar to the Class Pred Strict results only the criteria is a less stringent and will assign each sample to the class it most closely resembles.
T2 Vs. Q Residuals
It is also optional to view the T-Squared_Q_residuals_and_Contributions for each sub-model, and can provide useful information when fine tuning the SIMCA model.


