Knnscoredistance
Purpose
Calculate the average distance to the k-Nearest Neighbors in score space for calibration or prediction data. The KNN distance provides an estimate of how unique a sample in the score space of a model.
Synopsis
- distance = knnscoredistance(model,k,options)
- distance = knnscoredistance(model,pred,k,options)
Description
Given a factor-based model (PCA, PLS, PCR, MCR, etc), the KNN Score Distance gives the average distance to the k nearest neighbors in score space for each sample. This value is an indication of how well sampled the given region of the scores space was in the original model.
The KNN Score Distance is larger for samples which fall in lower-populated regions of score space. This may be a region within the score space or on the edges of the score space. Samples which have uniquely high leverage (Hotelling's T^2) will typically have large KNN score distance because they are on the edges of the sampled space and have fewer close neighbors than samples which fall in the middle of a cluster of samples.
For calibration data, high-distance indicates samples which may have high leverage and/or are otherwise unique in the score space. Adding samples like the high-distance samples may help stabilize a model.
For prediction data, high-distance indicates samples which appeared in regions of score space which were not well sampled by the calibration data. If there are underlying non-linear responses in the data, samples with high score distance may not be as accurate in their predictions.
If only a model and number of neighbors is given, the KNN Distance for the calibration set is calculated (this can be used as a reference for what is acceptable for a test sample). If both a model and a prediction structure are input along with the number of neighbors, the KNN Distance is calculated for the prediction samples.
Inputs
- model = a standard model structure for factor-based model.
Optional Inputs
- pred = a standard prediction structure from applying model to new data (e.g. output from PCA call: pred = pca(x,modl,options);)
- k = scalar value indicating the number of neighbors to which distance should be calculated and averaged over. If omitted or empty [], k=3 is used.
- Optional input options is discussed below.
Outputs
- distance = the average distance of each sample in model or pred to the k nearest neighbors in the calibration data (model).
Options
options = a structure array with the following fields:
- maxsamples: [ 2000 ], Maximum number of samples for which score distance will be calculated for. If a dataset (model or prediction) has more than this number of samples, the score distance will be returned as all NaN's. This is because the algorithm can be quite slow with many samples.
Example
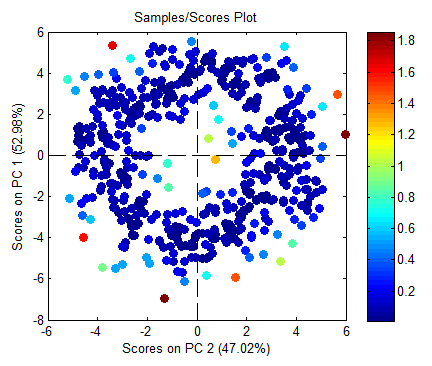
Below is a plot of the synthetic "doughnut" data created using:
s = randn(500,2);  %create random vectors
sc = [sin(s(:,1)*2*pi).*(4+s(:,2)),cos(s(:,1)*2*pi).*(4+s(:,2))];
pca(sc,2);  %calculate PCA model (and plot scores)
The color of each point represents the average distance in score space to given sample's 3 closest neighbors. The key for color is shown on the bar on the right of the figure and given in geometric distance.
Note that the samples on the inner and outer edges of the doughnut show higher distance to their neighbors.
See Also
cluster, knn, pca, plotscores, pls
