Review Results Quick Start
Previous Topic: Building Models
Flowchart
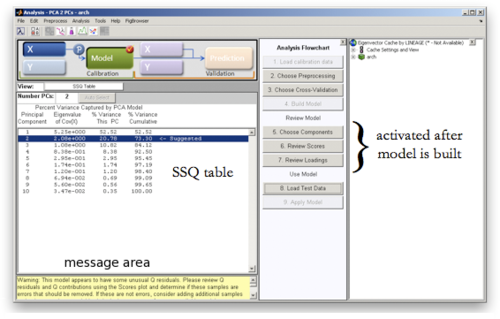
After a model has been built, the results window is updated and several buttons on the Analysis Flowchart are activated. In this example, the model has been built with two principal components as suggested by the software in the SSQ table, and the user is presented with a warning in the message box below the SSQ table.
Model Information
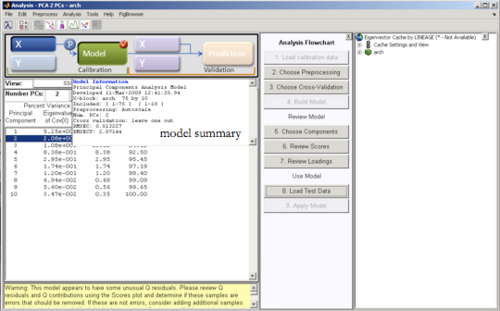
By placing your mouse cursor over the Model button, you will see a summary of the model that has been generated. Double-click the Model button to view this information in a separate window.
Since this model was built using cross-validation, a red check mark appears in the upper right hand corner of the Model button; moving the cursor over the check mark reveals the details of the cross-validation.
Choose Components
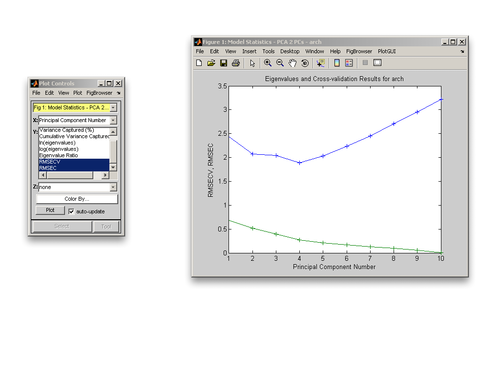
You may wish to change the number of principal components from the suggested number of two. By clicking on the "Choose Components" button in the Analysis Flowchart, you will be presented with a plot of some statistical figure of merit versus the number of components; in this case for a PCA model, a plot of RMSECV and RMSEC versus the number of principal components appears along with a Plot Controls window.
Update Model
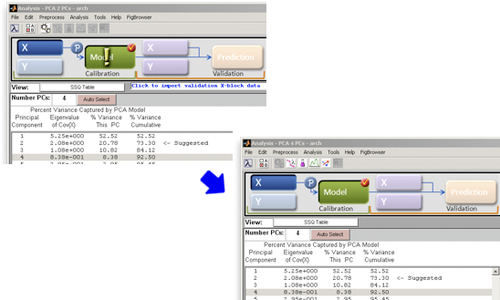
We decide, at least for the time being, to explore our model using four principal components. In order to update the model, we:
- select the line in the SSQ table for four principal components
- update the model calculation by clicking on the "Build Model" button, which becomes active after selecting a different number of PCs
Note that after selecting four principal components, items in the Analysis Flowchart that were previously accessible are now grayed out. The Model button is modified to indicate that the number of components has been changed. After clicking on the "Build Model"button in the Analysis Flowchart, the model is updated to reflect extending the model out to four PCs. The buttons entitled "Review Scores" and "Review Loadings" again become active.
Review Scores
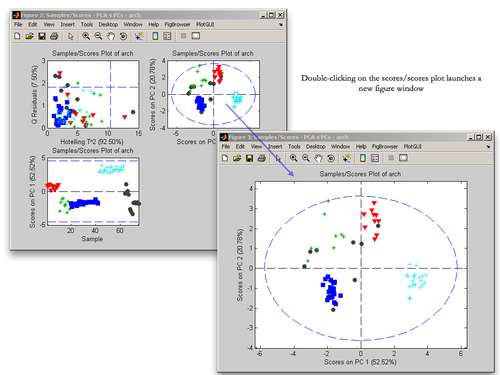
After clicking on "Review Scores", we are presented with a multiplot. The plots shown in this window are analysis-specific; for this PCA model, the following plots are displayed
- Q residuals vs. Hotelling's T2 statistic
- Scores on PC 2 vs. Scores on PC 1
- Scores on PC 1 vs. Sample index
Double-clicking on any of the individual plots in the window launches that individual plot in a separate figure window.
Plot Controls
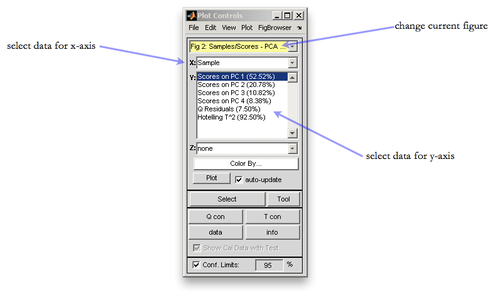
The Plot Controls window controls many aspects of the current figure, including
- changing the current figure
- choosing what data to plot for the x-axis
- choosing what data to plot for the y-axis
- choosing what data, if desired, to plot for the z-axis
Review Loadings
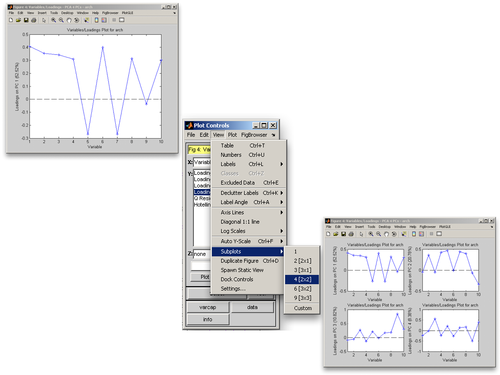
Information on the loadings can be displayed by clicking on the "Review Loadings" button in the Analysis Flowchart. As shown here, any plot can be converted into a multiplot by the following steps
- select "View" on the Plot Controls window
- select "Subplots"
- select the number of subplots
- click on each subplot within the figure to make it current, and use the Plot Controls window to select the data to view for that particular plot
