MIA Toolbox Review Results
Previous Topic: Building Models
|
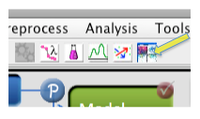
After a model has been built, the results window is updated and several buttons on the Analysis Flowchart are activated. In this example, the model has been built with 4 principal components and we're ready to look at results. When working with images in MIA_Toolbox, data is actually stored "unfolded" so numerical methods can properly calculate results. However, when results are display the data are "folded" back up when appropriate. Click the ImageGUI button to see a quick display of scores on the first 3 PCs. |
|
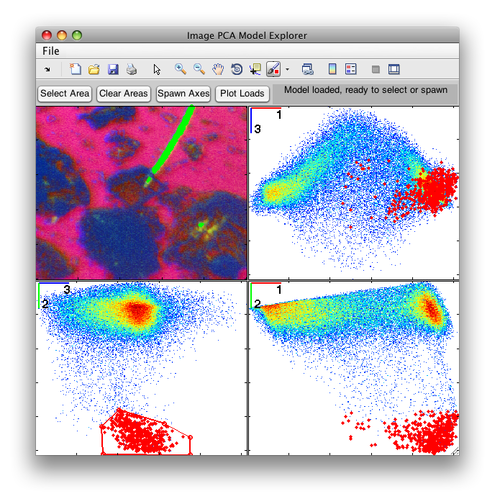
The ImageGUI is a PCA model exploring interface. It allows you to select areas in the image and or in scatter plots of the first 3 PCs. In the image to the right we are able to see where a feature within the image lies in the scores space. If you need to explore more than the first 3 PCs the ImageGUI functionality can be recreated using subplots within PlotGUI. |
|
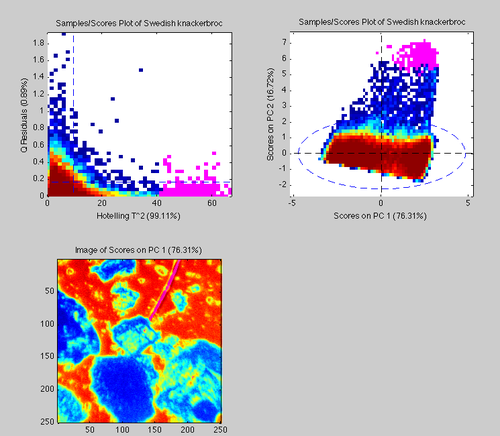
Opening a standard Scores plot shows Q vs T2, PC 1 vs PC 2, and a "folded" scores image. We can select a region high in T2 on the Q vs T2 plot and see where those points lie in our folded image. Click the Select button in the Plot Controls and select a region high in T2. These points will be highlighted in the other plots. |
|
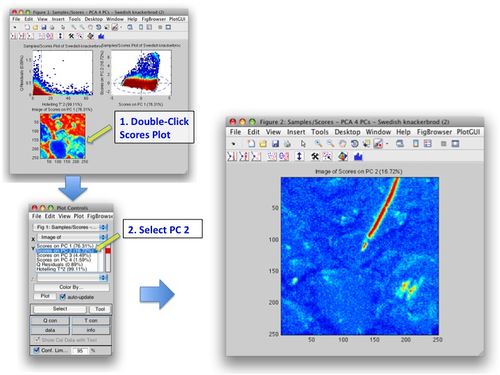
Double-clicking on that scores image will open it in a new window where you can explore it using the Plot Controls. By selecting the PC 2 you can see that it captures the narrow feature in the image.
|


