Analysis Tools Menu
Preprocessing
Whithin the Analysis GUI, the Preprocess menu allows setting and viewing of preprocessing options. Each block has a submenu for setting common preprocessing methods directly or for accessing the Custom Preprocessing GUI. After making a change to preprocessing, you will usually be required to recalculate the model. Preprocess>Plot Preprocessed Data menu allows you to displays the effects of the selected preprocessing on loaded data. The plot(s) are automatically updated to reflect any changes in preprocessing.
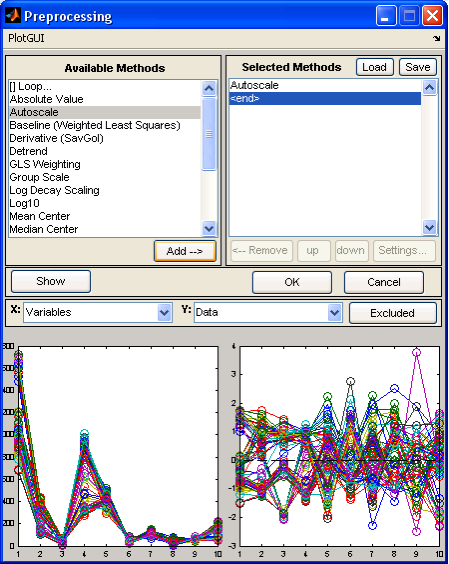
Custom Preprocessing window after Show button has been clicked.
The Custom Preprocessing window allows you to choose from a list of available preprocessing methods. After selecting a method from the available methods list, pressing the Add button will insert the selected method into the Selected Methods list on the right. Some methods will display an additional window for method specific settings when the item is added to the Selected Methods list. These settings can also be modified by selecting the method in the Selected Methods window, then pressing the Settings… button. Clicking OK load the new preprocessing structure into the GUI and the Status Pane will indicate that the model will need to be recalculated.
The Selected Methods are order specific – that is, they get applied in order from top to bottom. The order of preprocessing can have a very significant effect on an analysis; this should be carefully considered in the development of a model.
Note that n-way data have different preprocessing methods than 2-way data, and care should be taken when switching between 2-way and n-way data. Again, you must recalculate the model after making any changes to preprocessing.
You can load and save preprocessing settings from/to the MATLAB workspace and .mat files using the Custom Preprocessing window's Load button. The Show button will display two plots side by side with the raw data on the left and the preprocessed data on the right. You can select the axis values using the drop-down menus and toggle the Excluded button to show excluded data.
