Analysis Window: Analysis Flow Chart Pane: Difference between revisions
imported>Jeremy No edit summary |
imported>Jeremy No edit summary |
||
| Line 1: | Line 1: | ||
[[TableOfContents|Table of Contents]] | [[AnalysisWindow_AnalysisHelpPane|Previous]] | [[AnalysisWindow_ModelCachepane|Next]] | [[TableOfContents|Table of Contents]] | [[AnalysisWindow_AnalysisHelpPane|Previous]] | [[AnalysisWindow_ModelCachepane|Next]] | ||
Revision as of 16:46, 29 July 2010
Table of Contents | Previous | Next
Analysis window Flowchart pane
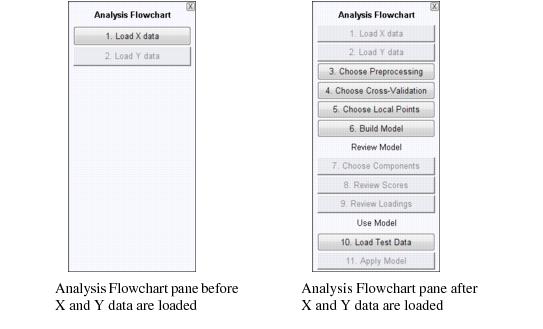
While the Status pane provides a graphical cue for the sequence of steps in the modeling process, the Analysis window Flowchart pane provides step by step instructions for using a particular analysis method. Each step is a button that you can click to interactively carry out the analysis according to the listed steps. The available steps in this pane are dynamically updated based on the last completed step. For example, as shown in the figure below, the Analysis Flowchart pane for a PLS regression initially contains only two steps-Load X data and Load Y data. If you were to click Load X data, then the Import dialog box would open and on this dialog box, you would select the X data for importing. You would then click Load Y data and on the Import dialog box, select the Y data to load. After you load the Y data, the Analysis Flowchart pane is automatically updated with additional steps for continuing with the analysis.
- Analysis window Flowchart pane
