Plot Controls: Layout: Difference between revisions
imported>Jeremy (Created page with '__TOC__ Table of Contents | Previous | Next | Index ==Plot Controls Window== The Pl…') |
imported>Jeremy (→Hello World: new section) |
||
| Line 67: | Line 67: | ||
* Annotating -[[http://www.mathworks.com/access/helpdesk/help/techdoc/creating_plots/f0-37626.html| http://www.mathworks.com/access/helpdesk/help/techdoc/creating_plots/f0-37626.html]] | * Annotating -[[http://www.mathworks.com/access/helpdesk/help/techdoc/creating_plots/f0-37626.html| http://www.mathworks.com/access/helpdesk/help/techdoc/creating_plots/f0-37626.html]] | ||
== Hello World == | |||
Hello everyone! | |||
Revision as of 08:10, 29 July 2010
Table of Contents | Previous | Next | Index
Plot Controls Window
The Plot Controls window is the principal data visualization tool for Solo. It contains an extensive number of tools for labeling, manipulating, and publishing plots that are contained in a Plot window. (See Plot window.)
You can open the Plot Controls window in one of two ways:
- You can right-click on any set of data (for example, on a set of data in the Workspace Browser window or on the X calibration control after you have loaded data into the control in an Analysis window) and on the context menu that opens, click Plot to open the Plot Controls window. (See Data plotting options, Data selection and editing options, and Other options.)
- You can click on an active Analysis window toolbar button that is specific for a plot (for example, an active Plot Eigenvalues button
 ).
).
Note: If you open the Plot Controls window by clicking on an Analysis window toolbar button, then the options that are available on the Plot Controls window are specific to the analysis method and the plot that is generated. Analysis-specific plot options are not discussed in this chapter.
Comparison of Plot Controls window
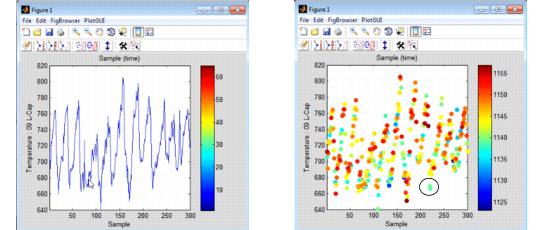
Regardless of how you open the Plot Controls window, two options are common to the window- auto-update and Color. Auto-update is selected by default. With this option selected, a plot in a Plot window is automatically updated after you make a change to a plot. If you clear this option, you must click Plot to manually update a plot after you make a change to it. You use the Color By option to implicitly superimpose the response of one variable onto the plot of another. For example, the figure shown below on the left is the plot of the response of variable 9 for all of the data samples. The figure shown below on the right is the plot of also the plot of the response of variable 9 for all of the data samples; however, the color of the data is points is based on the response of variable 15 for all of the data samples. As you can see in the figure on the right, a selected sample has a value of approximately 660 for variable 9, but it has a value in the 1100s for variable 15.
Color By example
Plot window
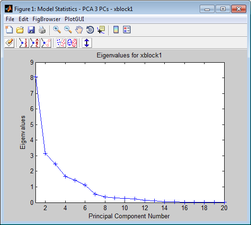
Most plots created in Solo are contained in a Plot window. For example, the figure below shows an Eigenvalues plot in a Plot window.
Eigenvalues plot in a Plot window
You can create multiple plots during an analysis session, and the plots are automatically numbered as they are created. The number is displayed in the Title bar of the Plot window. Most of the plots that you create during an analysis session are under the control of a single Plot Controls window. The Figure Selector dropdown list in the Plot Controls window contains a list all of the plots created during an analysis session and that are under control of the window. At any time, you can select a figure from this list to make it the active plot for the session.
Example of multiple plots automatically numbered
All Plot windows, regardless of the plot that they contain, have the same main menu and the same toolbars.
- Main menu-The main menu is set up in a standard Windows menu format with commands grouped into menus (File, Edit, FigBrowser, and PlotGUI) across the menu bar. This menu contains variety of options for working with the plot in the Plot window and modifying the appearance of the plot in the Plot window. For example, the Edit menu contains options for editing the plot axes and the plot font settings.
Plot window main menu
- Toolbar-The Plot window has two toolbars. The top toolbar contains the buttons for common Matlab plotting tools. The bottom toolbar contains an option for viewing and opening the data in the DataSet editor as well as options for changing the appearance of the plot. Place your mouse pointer over a toolbar button to open tooltip text for the button.
Plot window toolbar
Note: For assistance with using any of the common Matlab plotting tools, see:
Hello World
Hello everyone!


