Building Models Quick Start: Difference between revisions

From Eigenvector Research Documentation Wiki
Jump to navigation Jump to search
imported>Scott
No edit summary
imported>Scott
No edit summary
Line 7: Line 7:
|valign="top"|
|valign="top"|
* The Analysis GUI will then appear with the given data already loaded. (The large '''X''' (block) button in the Analysis GUI will appear depressed indicating the data is loaded - passing the cursor over the button will provide a summary of the '''X''' block data.)
|:[[Image:build_model.004.png]]
|[[Image:build_model.004.png]]
|-
|-
|valign="top"|  
|valign="top"|  
Line 27: Line 27:
* You can quickly view your data by right-clicking on the appropriate button ('''X''' or '''Y''') and then select '''"Plot Data"'''


|:[[Image:build_model.005.png]]
|valign="top"|[[Image:build_model.005.png]]
|-
|-
|valign="top"|
|valign="top"|

Revision as of 11:19, 13 March 2009

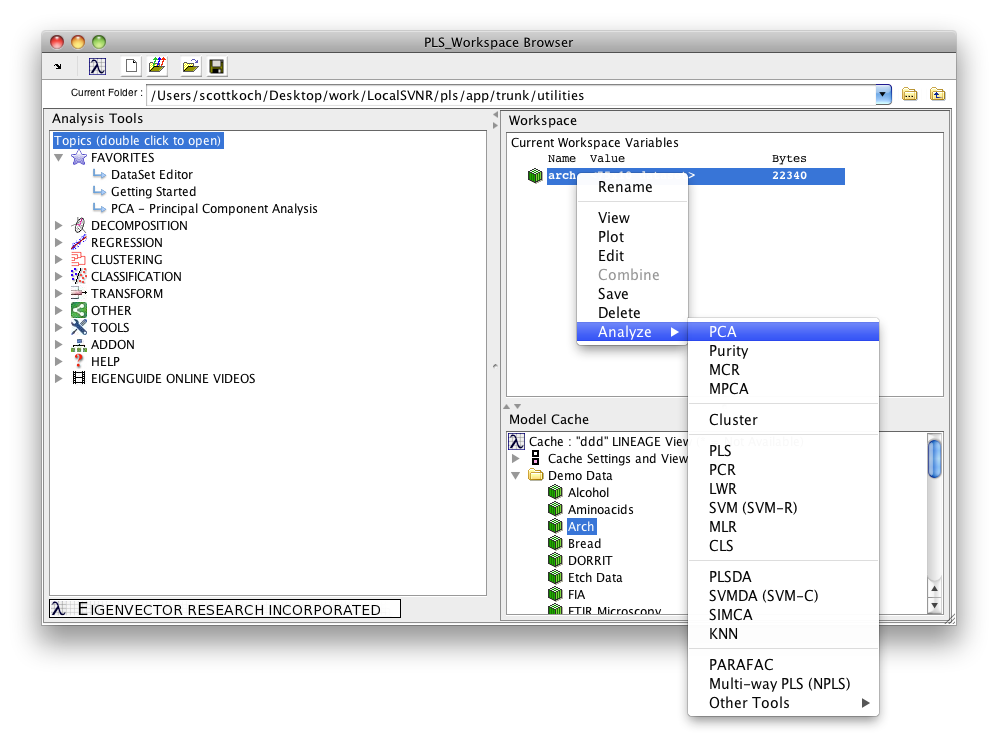
  • Once data has been loaded into the workspace, there are several ways to begin building a model. For analysis tools like PCA where only an X block is required, you can right-click on the data icon in the Browser to reveal a list of analysis options. You can also drag the given data to an analysis method shortcut, such as the Decompose PCA shortcut.
Build model.003.png
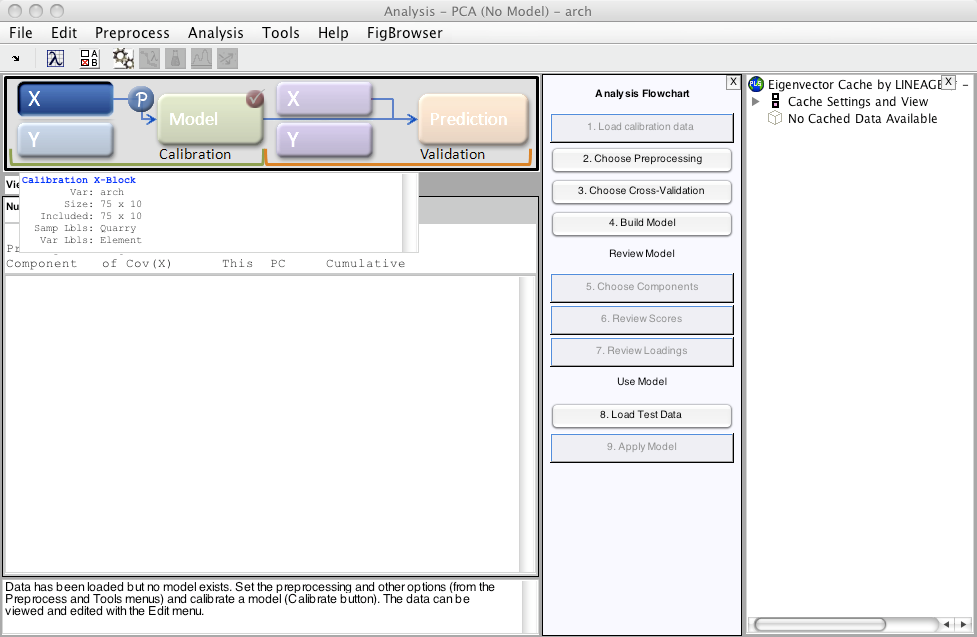
  • The Analysis GUI will then appear with the given data already loaded. (The large X (block) button in the Analysis GUI will appear depressed indicating the data is loaded - passing the cursor over the button will provide a summary of the X block data.)
Build model.004.png
  • While each analysis type has its own nuances, in general the steps to build a model are:
    • load the data
    • view the data
    • choose preprocessing
    • select the type of cross-validation to use (if any is desired - see Using Cross-Validation)
    • build the model
    • review the model
  • There is more than one way to accomplish each of the above steps. For example, preprocessing can be set for the X block by
    • clicking the "Choose Preprocessing" button in the Analysis Flowchart
    • clicking the P button next to the X button
    • select "Preprocess" menu item

(Hint: Once selected, use the Preprocess/X-block and Preprocess/Y-block menus to save the current preprocessing as the default.)

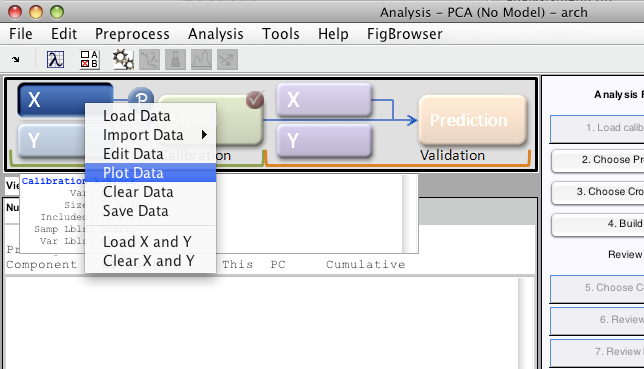
  • You can quickly view your data by right-clicking on the appropriate button (X or Y) and then select "Plot Data"
Build model.005.png
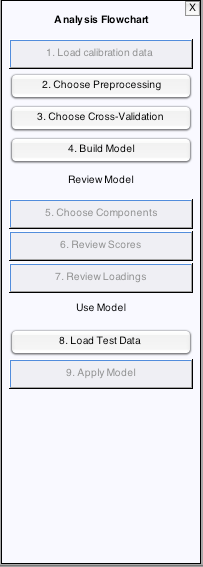
  • Perhaps the quickest way for new users to complete the remaining steps to build the model is to use the flowchart.
Build model.006.png

Next Topic: Review Results