Diviner review results: Difference between revisions
No edit summary |
No edit summary |
||
| Line 74: | Line 74: | ||
File: Diviner_Results_Table.png | File: Diviner_Results_Table.png | ||
File: Diviner_Results_Table_Right_click.png | File: Diviner_Results_Table_Right_click.png | ||
</gallery> | |||
===Variable Consensus Plot=== | |||
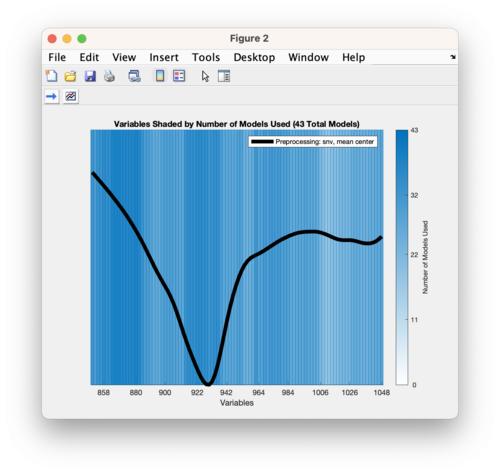
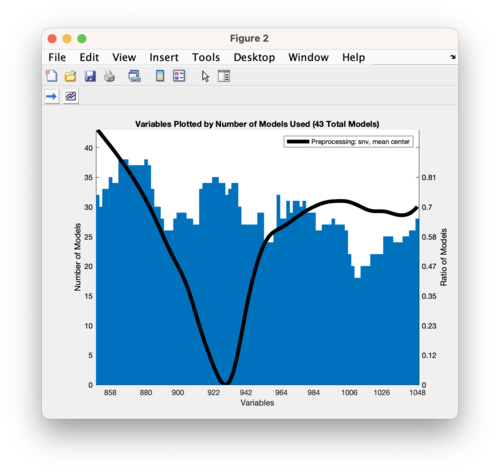
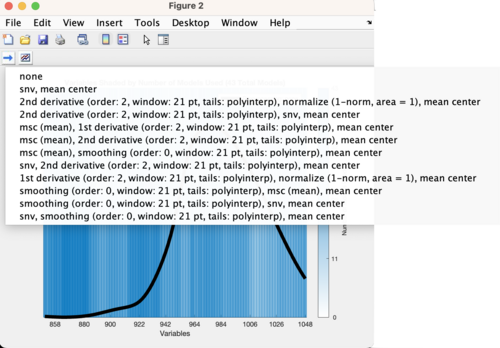
The variable consensus plot indicates the number of models that use a particular variable. A darker blue shade indicates that the variable is used in more models. Use the '''Change Plottype''' button to change the plot to a bar plot and back to a shade plot. Use the '''Change Preprocessing''' button to select a different preprocessing recipe to apply to data and show a mean of the preprocessed data on the plot. | |||
<gallery widths=500px heights=500px mode="nolines"> | |||
File: Diviner_Variable_Consensus_Plot.png | |||
File: Diviner_Variable_Consensus_Change_Plot_button.png | |||
File: Diviner_Variable_Consensus_Bar_plot.png | |||
File: Diviner_Variable_Consensus_Plot_Prepro_List.png | |||
</gallery> | </gallery> | ||
Revision as of 10:16, 4 September 2024
Diviner Results
Results Plot
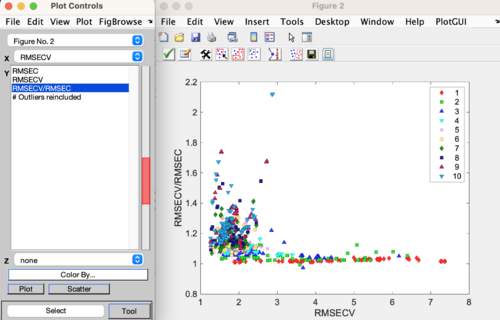
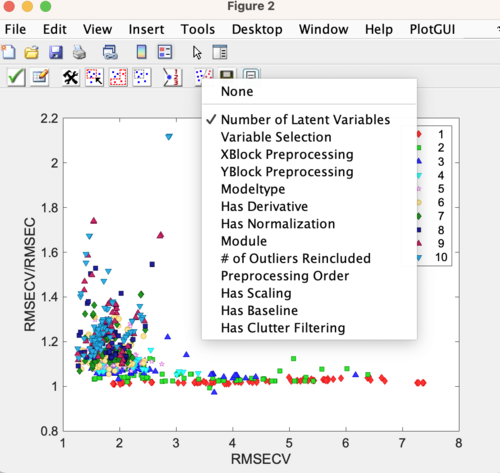
The Diviner results plot will automatically appear when Diviner has finished calculating all the models. The results plot has several class sets that give information about the models. Use the View Classes/Select Class button to change what class set is shown in the plot. By default the first class set shown is the Number of Latent Variables.
Class Sets
The class sets are:
- Number of Latent Variables
- 1 through the max number of latent variables used to build the models
- Variable Selection
- indicates the variable selection method; None (no variable selection), Automatic (using selectvars), or iPLS (if selected during model refinement)
- XBlock Preprocessing
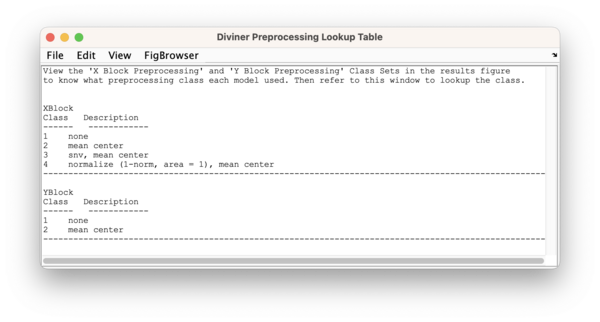
- indicates the different x-block preprocessing recipes used to build the models. Use along with the Preprocessing Class Lookup table. See image below.
- YBlock Preprocessing
- indicates the different y-block preprocessing recipes used to build the models. Use along with the Preprocessing Class Lookup table. See image below.
- Modeltype
- the different model types. As of version 9.5 this will be PLS and/or MLR (if MLR is turned on in the options settings)
- Has Derivative
- indicates if a model has a derivative preprocessing step and if the order of the derivative
- Has Normalization
- indicates if a model has a normalization preprocessing step and the type of normalization (MSC, SNV, etc.)
- Module
- indicates where the model came from in the Diviner run, Initial Gridsearch or Latent Variable Survey
- # of Outliers Reincluded
- indicates the number of outlier re-included, if Outlier re-inclusion was selected during model refinement
- Preprocessing Order
- indicates the order of derivative and normalization preprocessing steps (neither derivative nor normalization, derivative+normalization, or normalization+derivative)
- Has Scaling
- indicates if a model has any scaling preprocessing steps (Autoscale, Poisson, Pareto, etc.)
- Has Baseline
- indicates if a model has any baseline correction preprocessing steps and what type (Whittaker, Specified Points, or Automatic Weighted Least Squares)
- Has Clutter Filtering
- indicates if a model has any clutter filtering preprocessing steps and what type (GLSW or EPO)
Here's an example of a Preprocessing Lookup table. Note: if there are many preprocessing recipes (greater than 50) then select the model of interest and right click and choose Show X-block preprocessing.
Selecting Models
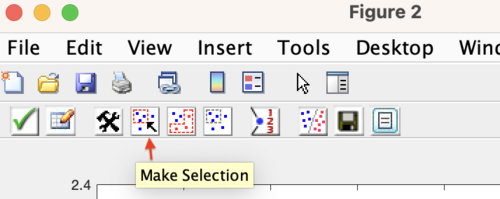
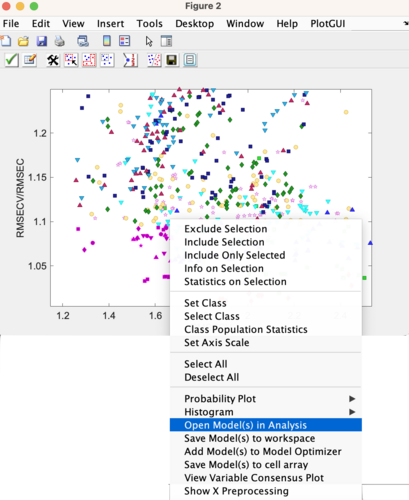
Use the Make Selection button to select the models. It is recommended to select models that are in the lower left portion of the plot, as these models show good performance (low RMSECV) and are not over-fit (low RMSECV/RMSEC ratio). Right click on a selected model to bring up the available options, which are:
- Open in the Analysis window
- Save to the workspace
- Add to Model Optimizer
- Save to a cell array
- View Variable Consensus plot
- Show X-block preprocessing
- Tip: Use this when there are more than 50 preprocessing recipes
Results Table
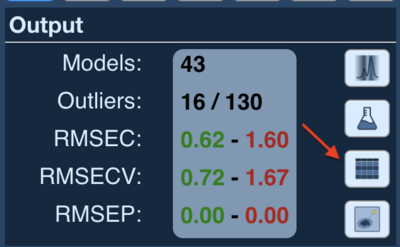
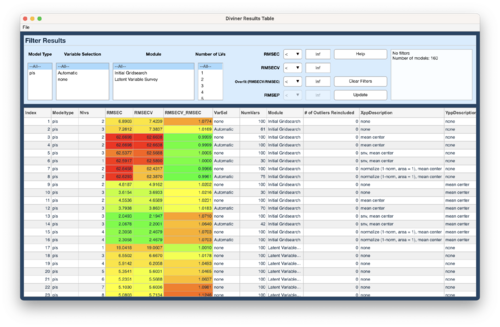
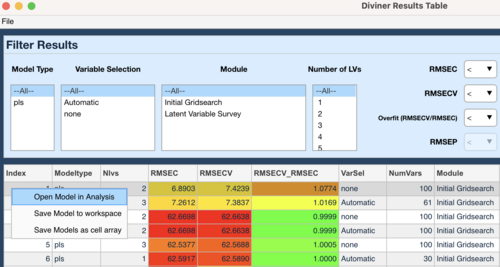
Use the Open results table button in the Diviner interface to open a tabular view of the Diviner results. The results table allows filtering the results based on different various model parameters such as; model type, variable selection, number of latent variables, and RMSEC, RMSECV, and overfit (RMSECV/RSMEC) values. A model (or models) can be saved to the workspace or loaded into the PLS Analysis window by selecting a row (or multiple rows) in the table and right clicking and then choosing the desired action.
Variable Consensus Plot
The variable consensus plot indicates the number of models that use a particular variable. A darker blue shade indicates that the variable is used in more models. Use the Change Plottype button to change the plot to a bar plot and back to a shade plot. Use the Change Preprocessing button to select a different preprocessing recipe to apply to data and show a mean of the preprocessed data on the plot.
