Diviner review outliers: Difference between revisions
No edit summary |
No edit summary |
||
| Line 49: | Line 49: | ||
# Accept and Close - accept the highlighted samples and close figure | # Accept and Close - accept the highlighted samples and close figure | ||
# Highlight samples - change how samples are highlighted. See above section for more information. | # Highlight samples - change how samples are highlighted. See above section for more information. | ||
# Deselect samples - | # Deselect samples - un-highlight the currently highlighted samples | ||
# Sort Samples - sort samples by index or ascending y value | # Sort Samples - sort samples by index or ascending y value | ||
# View Robust Models - open robust PLS or PCA models in Analysis | # View Robust Models - open robust PLS or PCA models in Analysis | ||
# Help - open Help image | # Help - open the Help image | ||
===Manually Highlight and Un-highlight Samples=== | |||
Click on the plot to manually highlight or un-highlight a sample. '''Note:''' If needed, zoom in on the plot to help achieve this. | |||
Revision as of 07:56, 26 August 2024
Outlier Detection
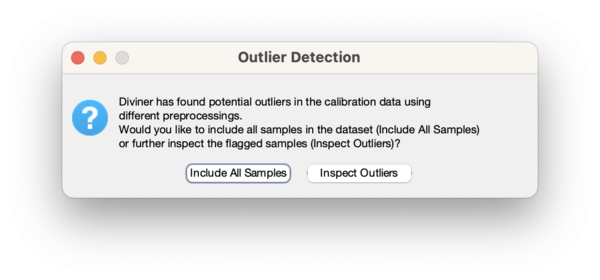
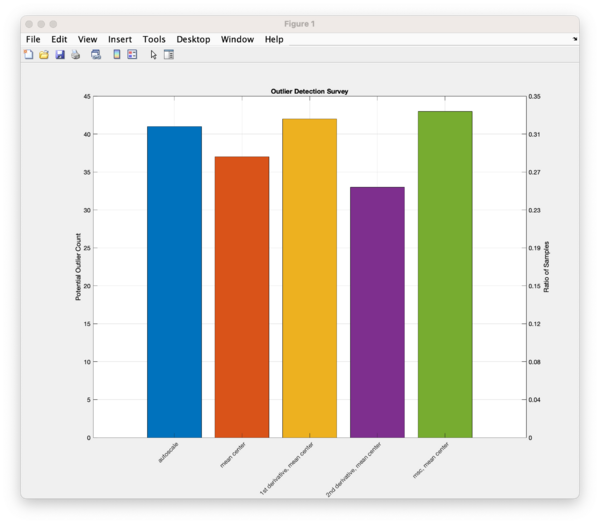
If a Diviner run is started with outlier detection turned on then outlier detection will be performed for each preprocessing method designated by the user. Decisions will need to be made regarding how to handle samples detected as outliers. This Outlier Detection message will appear along with a plot of the Outlier Detection Survey:
The Outlier Detection Survey shows the number of samples (left axis) and ratio of samples (right axis) per preprocessing method designated to use for outlier detection.
Use the Include All Samples button to keep all samples in the model building process. If you would like to further inspect the samples flagged as potential outliers click on the Inspect Outliers button. This will open the Potential Outlier Status for each Preprocessing plot.
Potential Outlier Status for each Preprocessing
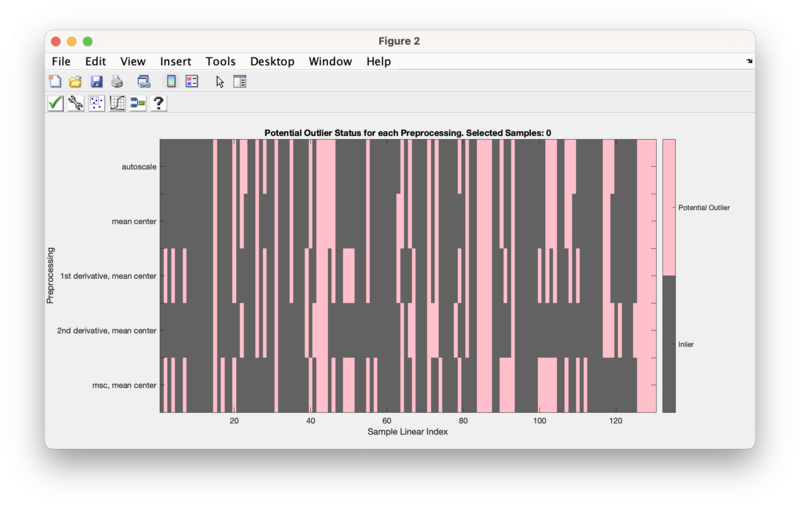
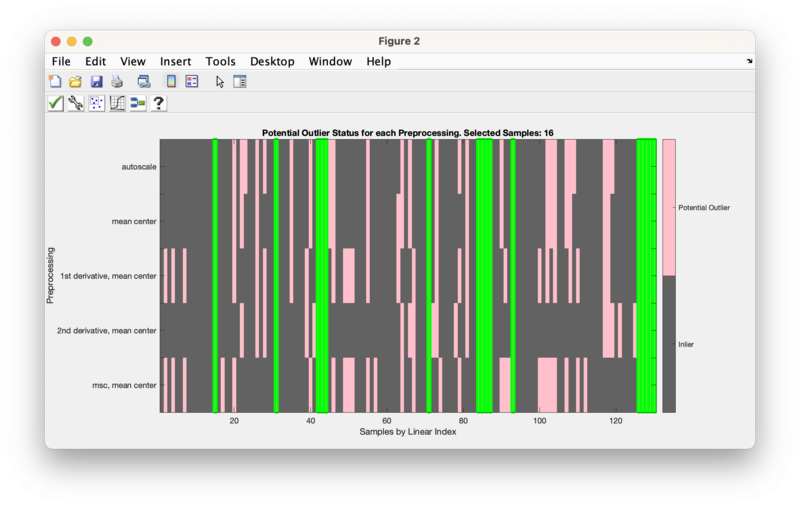
The Potential Outlier Status for each Preprocessing plot will allow selecting samples to be flagged as outliers and thus not used in the model building process.
This plot shows the sample index numbers on the x-axis and the outlier preprocessing methods on the y-axis. Samples that are potential outliers for each preprocessing method are colored pink.
Potential Outlier Status Toolbar
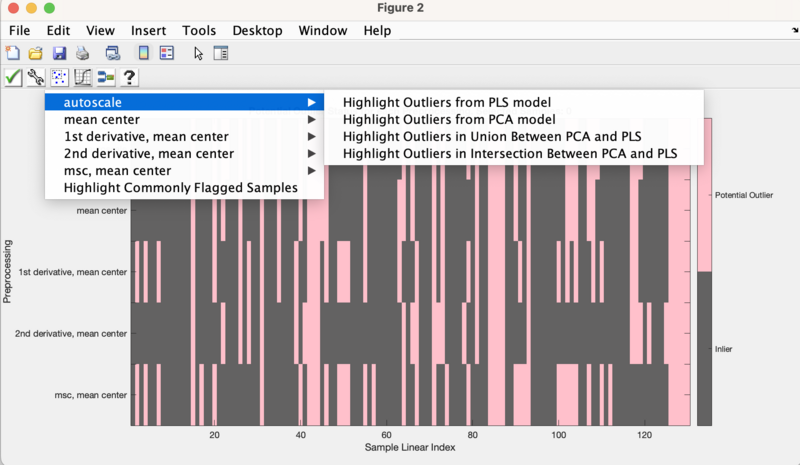
Use the wrench icon to change how the potential outliers are highlighted.
For each outlier preprocessing method you can choose to highlight samples from:
- The robust PLS model
- The robust PCA model
- The union between the robust PLS and robust PCA models. This will give the unique samples from both models.
- The intersection between the robust PLS and robust PCA models. This will give only the samples that are present in both models.
The last option, Highlight Commonly Flagged Samples, allows highlighting the samples flagged as outliers in all of the preprocessing methods.
Accept Highlighted Samples
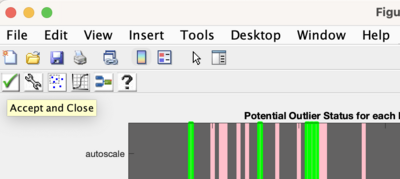
Once the potential samples are highlighted, use the Accept and Close button (green check icon) to accept this selection and close the figure. These samples will be excluded from the model process.
Additional Toolbar Buttons
- Accept and Close - accept the highlighted samples and close figure
- Highlight samples - change how samples are highlighted. See above section for more information.
- Deselect samples - un-highlight the currently highlighted samples
- Sort Samples - sort samples by index or ascending y value
- View Robust Models - open robust PLS or PCA models in Analysis
- Help - open the Help image
Manually Highlight and Un-highlight Samples
Click on the plot to manually highlight or un-highlight a sample. Note: If needed, zoom in on the plot to help achieve this.
