Faq what are reduced T^2 and Q Statistics: Difference between revisions
imported>Lyle No edit summary |
No edit summary |
||
| (6 intermediate revisions by 2 users not shown) | |||
| Line 1: | Line 1: | ||
===Issue:=== | ===Issue:=== | ||
What are the "Reduced" T | What are the "Reduced" T<sup>2</sup> and Q Statistics? | ||
===Possible Solutions:=== | ===Possible Solutions:=== | ||
| Line 7: | Line 7: | ||
Hotelling's T<sup>2</sup> (T-squared) and Q residuals (sum squared residuals) are often reported in units which are sensitive to the total number of variables in the data, and the number of components and particular preprocessing used for a model. As a result, comparison of values reported by different models, or setting a standard alarm level for all models requires normalizing the statistics. | Hotelling's T<sup>2</sup> (T-squared) and Q residuals (sum squared residuals) are often reported in units which are sensitive to the total number of variables in the data, and the number of components and particular preprocessing used for a model. As a result, comparison of values reported by different models, or setting a standard alarm level for all models requires normalizing the statistics. | ||
A common way to normalize the statistics is to divide by a confidence limit calculated from each model's particular data and parameters (In PLS_Toolbox and Solo, the default confidence limit is at the 95% level.) The Reduced Q and Reduced T<sup>2</sup> are simply the statistic divided by the corresponding confidence limit. | A common way to normalize the statistics is to divide by a confidence limit calculated from each model's particular data and parameters (In PLS_Toolbox and Solo, the ''default'' confidence limit is at the 95% level.) The '''Reduced Q''' and '''Reduced T<sup>2</sup>''' are simply the statistic divided by the corresponding confidence limit. | ||
'''PLS_Toolbox''' | '''PLS_Toolbox''' | ||
In PLS_Toolbox and Matlab, you can view the exact value used to normalize by | In PLS_Toolbox and Matlab, you can view the exact value used to normalize by displaying the following fields in a model: | ||
>>q_limit = model.detail.reslim{1} | >> q_limit = model.detail.reslim{1} | ||
>>t2_limit = model.detail.tsqlim{1} | >> t2_limit = model.detail.tsqlim{1} | ||
'''Solo (and Solo variants)''' | |||
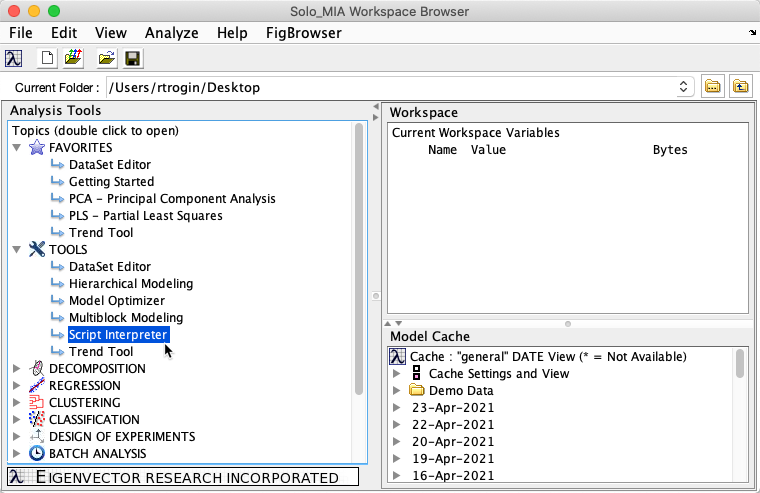
You can use the <strong>Script Interpreter</strong> tool to access model properties. The <strong>Script Interpreter</strong> may be found in the <strong>Workspace Browser</strong> under the <strong><em>Tools</strong></em> group: | |||
[[File:ScriptInterpreter.png|full]] | |||
As an example with a model in the workspace with the name of <code>myModel</code>, enter the following in the <strong>Script Interpreter</strong> under the '''''Script''''' section: | |||
<code>myModel.detail.reslim{1};</code> | |||
<code>myModel.detail.tsqlim{1};</code> | |||
[[File:ScriptInterpreterResults.png|full]] | |||
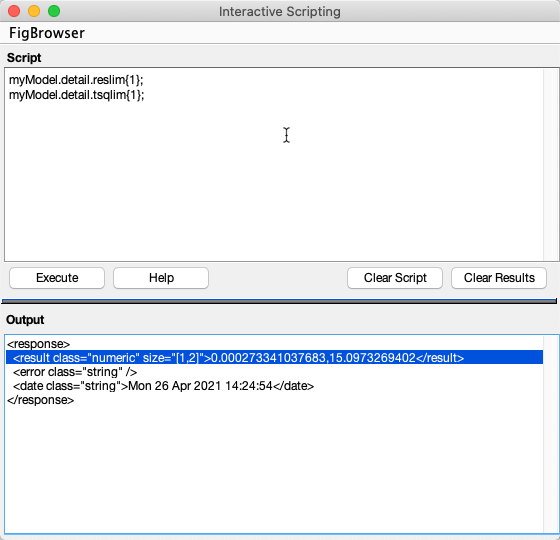
The '''''Output''''' section will display two numerical values under the <code><result></code> tag, the first being the confidence limit for the Q residuals and the second the confidence limit Hotelling's T<sup>2</sup>. | |||
'''Still having problems? Please contact our helpdesk at [mailto:helpdesk@eigenvector.com helpdesk@eigenvector.com]''' | |||
[[Category:FAQ]] | [[Category:FAQ]] | ||
Latest revision as of 16:24, 17 May 2021
Issue:
What are the "Reduced" T2 and Q Statistics?
Possible Solutions:
Hotelling's T2 (T-squared) and Q residuals (sum squared residuals) are often reported in units which are sensitive to the total number of variables in the data, and the number of components and particular preprocessing used for a model. As a result, comparison of values reported by different models, or setting a standard alarm level for all models requires normalizing the statistics.
A common way to normalize the statistics is to divide by a confidence limit calculated from each model's particular data and parameters (In PLS_Toolbox and Solo, the default confidence limit is at the 95% level.) The Reduced Q and Reduced T2 are simply the statistic divided by the corresponding confidence limit.
PLS_Toolbox
In PLS_Toolbox and Matlab, you can view the exact value used to normalize by displaying the following fields in a model:
>> q_limit = model.detail.reslim{1}
>> t2_limit = model.detail.tsqlim{1}
Solo (and Solo variants)
You can use the Script Interpreter tool to access model properties. The Script Interpreter may be found in the Workspace Browser under the Tools group:
As an example with a model in the workspace with the name of myModel, enter the following in the Script Interpreter under the Script section:
myModel.detail.reslim{1};
myModel.detail.tsqlim{1};
The Output section will display two numerical values under the <result> tag, the first being the confidence limit for the Q residuals and the second the confidence limit Hotelling's T2.
Still having problems? Please contact our helpdesk at helpdesk@eigenvector.com

