Modeloptimizergui: Difference between revisions
imported>Scott |
imported>Scott No edit summary |
||
| Line 8: | Line 8: | ||
After all models have been calculated the results are displayed in a comparison table. By default the table shows only columns that differ between the models but it can be customized. Each column can be sorted so you can quickly identify trends in your results. | After all models have been calculated the results are displayed in a comparison table. By default the table shows only columns that differ between the models but it can be customized. Each column can be sorted so you can quickly identify trends in your results. | ||
=Getting Started= | =Getting Started= | ||
Revision as of 20:43, 22 May 2013
Introduction
Optimizing modeling conditions and settings requires building and comparing multiple models. The Model Optimizer allows you to both automate building of models and visualize a comparison of models.
The interface is based around the idea of a "Snapshot" of the Analysis model building interface. Each snapshot contains all the settings for building the model. Once a set of snapshots has been created, the Model Optimizer can assemble all combinations of the settings into a collection of models to calculate. This collection can then be run at a convenient time or saved and run on new data.
After all models have been calculated the results are displayed in a comparison table. By default the table shows only columns that differ between the models but it can be customized. Each column can be sorted so you can quickly identify trends in your results.
Getting Started
Snapshots can be take from the Analysis toolbar or the Model Optimizer toolbar by clicking the snapshot button (camera icon).
Unsupported Model Types
Classification
- CLUSTER
Decomposition
- PURITY
- Batch Maturity
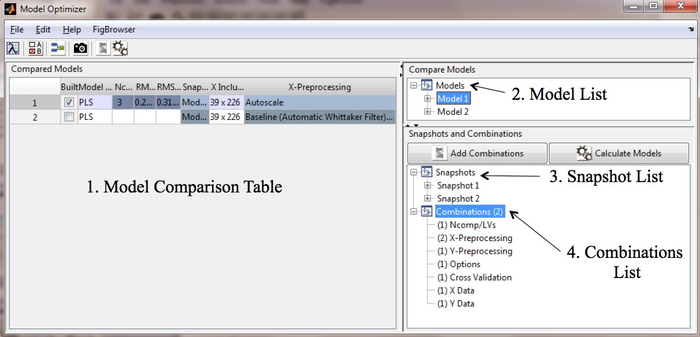
Model Optimizer Window
The main Optimizer Window has 4 sections:
- Model comparison table.
- Model list.
- Snapshot list.
- Combinations list.
