Workspace Browser: Layout: Difference between revisions
imported>Jeremy |
imported>Jeremy |
||
| Line 39: | Line 39: | ||
===Toolbar=== | ===Toolbar=== | ||
The toolbar provides quick access to some of the most commonly used Workspace Browser functions. Place your mouse pointer over a toolbar button to open tooltip text for the button. Some of these functions are available in other areas of the browser. | The toolbar provides quick access to some of the most commonly used Workspace Browser functions as well as the program's current working directory. Place your mouse pointer over a toolbar button to open tooltip text for the button. Some of these functions are available in other areas of the browser. | ||
:: | :: | ||
Revision as of 09:35, 23 September 2010
Table of Contents | Previous | Next
Workspace Browser
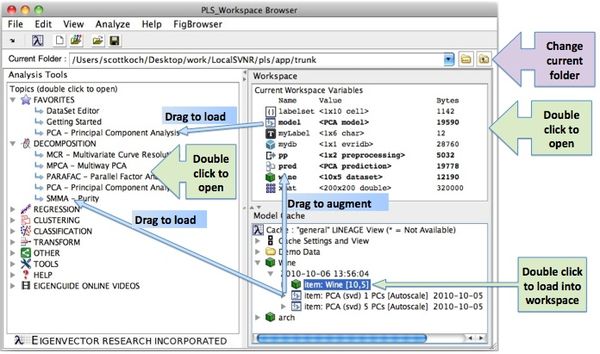
The Workspace Browser opens automatically when you launch Solo and is your starting interface for Solo. The interface provides quick access to all of the data analysis tools. The browser also serves as your "scratch pad" in Solo-you can pre-process data for analysis in the browser, or you can import data into the browser and then manipulate the data prior to analysis. The Solo Workspace Browser has five major components-the base workspace pane, the analysis tools pane, the model cache pane, the toolbar, and the window menus.
Base Workspace Pane
The Workspace pane shows the contents of the base workspace. The base workspace contains data icons for each of the data items you have imported into the base workspace. For more on these topics see:
Analysis Tools Pane
The Analysis Tools pane contains the shortcut icons for all of the tools available. They are organized into categories under which are various shortcut icons. Some of the shortcut icons open the Analysis window in a specific analysis mode (for example, if you click "PCA - Principal Component Analysis", the Analysis window opens with PCA as the selected analysis mode) and some of these icons open other windows (for example, if you click GA Variable selection, the Genetic Algorithm Variable Selection window opens).
The "HELP" category contains a Getting Started icon which launches the Eigenvector Research Documentation wiki, and the "TOOLS" Category contains a Choose Shortcuts icon, which opens the Select Shortcuts to Show dialog box. You can use the options in this dialog box to specify which shortcut icons are displayed in the base workspace for your Workspace Browser. (See Workspace Browser Preferences.)
Right-clicking on any tool shortcut gives a context menu in which you can make the tool a "favorite" which includes it in the top "FAVORITES" category, making it fast to locate.
Model Cache Pane
The Model Cache pane contains all the models and data you have built recently (assuming the Model Cache is turned on. This pane works similarly to the model cache pane in the Analysis window (follow link for more information). Note that you can drag and drop any item from the model cache into an Analysis Tools shortcut to automatically load that item from the model cache, or right-click an item to perform other actions such as editing, plotting, or saving.
The main menu has commands grouped into menus (File, Edit, View, Analyze, Help and FigBrowser) across the menu bar. Some of these menu commands are available in other areas of the browser.
Note: The File > Remote Automation command allows the control of Solo by another program. If Solo is running, certain third party programs can connect to Solo and directly "dump" data into Solo and even start an Analysis window with the data loaded. This prevents you from having to carry out the manual process of opening a file, importing the file, and bringing the file into the Analysis window. Contact Eigenvector for assistance with this function.
Toolbar
The toolbar provides quick access to some of the most commonly used Workspace Browser functions as well as the program's current working directory. Place your mouse pointer over a toolbar button to open tooltip text for the button. Some of these functions are available in other areas of the browser.
|
Button |
Function |
|
|
Refresh Browser icon - Refreshes the current display for the Workspace Browser. |
|
|
Change Working Directory icon - Opens the Browse for Folder dialog box which you use to browse to and select a different working directory (the directory that is associated with the current Workspace Browser process.) |
|
|
New Dataset icon - Opens the New DataSet dialog box which you use to specify the size and initial value for a new DataSet, which is the object used in Solo for managing data. |
|
|
Import Data icon - Opens the Import dialog box which you use to select a specific data file type for importing into Solo. |
|
|
Load Workspace icon - Opens the Load Workspace dialog box from which you can select a .mat file to load into the Workspace Browser. (See Save Workspace icon below.) |
|
|
Save Workspace icon - Saves the currently loaded items to a single .mat file. You can save as many .mat files as needed to fit your working requirements, and then use the Load Workspace icon to load a saved .mat file into the base workspace. |
