Demonstration Datasets: Difference between revisions
Jump to navigation
Jump to search
imported>Donal |
imported>Donal |
||
| Line 32: | Line 32: | ||
|fia || UV detection of Flow Injection Analysis of hydroxy-benzaldehyde (n-way data: sample, wavelength, time). | |fia || UV detection of Flow Injection Analysis of hydroxy-benzaldehyde (n-way data: sample, wavelength, time). | ||
|- | |- | ||
|flucuttest || dataset | |flucuttest || dataset used by FLUCUTDEMO. | ||
|- | |- | ||
|FTIR_microscopy || FTIR microscopy transect spectra of a three-layer polymer laminate. | |FTIR_microscopy || FTIR microscopy transect spectra of a three-layer polymer laminate. | ||
Revision as of 15:11, 27 September 2012
List of DataSets
The following is a list of the data supplied with PLS_Toolbox. It consists of the name of the file (all end in ".mat" unless otherwise specified) along with a brief description of the contents of the given file. Each file may contain one or more variables to be used.
| alcohol | Biological fluid analysis of alcoholics for discriminant analysis. |
| aminoacids | AMINOACIDS Fluorescence EEM of 5 samples for PARAFAC. |
| arch | ARCH Archeological artifact data set for PCA amd SIMCA examples. |
| biscuit | NIR reflectance spectra of 40 samples of biscuit dough from 1200-2398nm.. |
| brain_weight | Body mass (kg) and brain mass (g) for 28 animals. |
| bread | Sensory evaluation of breads. |
| cancer | Fluorescence EEM spectra extracted from cervical cancer images. |
| data_mid_IR | Data sets for correlation spectroscopy. |
| data_near_IR | Data sets for correlation spectroscopy. |
| dorrit | DORRIT EEM of 27 samples with 4 flourophores for PARAFAC. |
| Dupont_BSPC | 10 process variables (pressure, flow, temperature) for 55 batches with 7 steps each. |
| etchdata | Engineering process data from semiconductor metal etch (MPCA). |
| fia | UV detection of Flow Injection Analysis of hydroxy-benzaldehyde (n-way data: sample, wavelength, time). |
| flucuttest | dataset used by FLUCUTDEMO. |
| FTIR_microscopy | FTIR microscopy transect spectra of a three-layer polymer laminate. |
| gcwine | Dynamic headspace GCMS data of red wines from different regions. |
| halddata | HALDDATA Hald cement curing data. |
| lcms | LC/MS electrospray of 15 surfactant solution. |
| lcms_compare1 | Select data from LC/MS electrospray data set. |
| lcms_compare2 | Select data from LC/MS electrospray data set. |
| lcms_compare3 | Select data from LC/MS electrospray data set. |
| MS_time_resolved | Direct probe time profile MS of three color-coupling compounds. |
| MS_time_resolved_references | Reference spectra of pure compounds from MS_time_resolved. |
| nir_data | NIR_DATA NIR spectra of pseudo gasoline samples for STDDEMO. |
| nmr_data | NMR_DATA NMR data for GRAM demo. |
| octane | NIR spectra and octane number values of 39 gasoline samples. |
| oesdata | OESDATA Optical emission spectra from metal etch. |
| OliveOilData | 36 FT-IR spectra (3600 - 600 cm-1) of olive oils. |
| paint | PAINT Non-linear paint formulation data. |
| pcadata | PCADATA Slurry Fed Ceramic Melter data. |
| plsdata | PLSDATA SFCM data for PCR and PLS demos. |
| plslogo | PLSLOGO Data used to construct the PLS logo. |
| projdat | PROJDAT Projection demo data for PROJDEMO. |
| pulsdata | Time series data from a Slurry Fed Ceramic Melter for PLSPULSM demo. |
| purvardata | Raman spectra used in "Chemometrics Tutorial" section "MATLAB Code for Pure Variable Method, (chapter 9)". |
| purvardata_noise | Raman spectra used in "Chemometrics Tutorial" section "MATLAB Code for Pure Variable Method, (chapter 9)". |
| raman_dust_particles | Raman spectra used in "Chemometrics Tutorial" section "FTIR Microscopy Example", (chapter 9). |
| raman_dust_particles_references | Raman spectra used in "Chemometrics Tutorial" section "FTIR Microscopy Example", (chapter 9). |
| raman_time_resolved | Raman spectra of a time resolved reaction, used in "Chemometrics Tutorial". |
| replacedata | REPLACEDATA SFCM data for REPLACEDEMO. |
| sawdata | SAWDATA Surface acoustic wave sensor data. |
| SBRdata_EU | NIR transmission spectra of styrene-butadiene copolymers. |
| stars | Surface temperature and light intensity values for 47 stars. |
| statdata | STATDATA Data sets for ANOVA and statistics STATDEMO. |
| sugar | SUGAR Fluorescence EEM N-way data set. |
| svmocdemo | Synthetic sample data used by SVMOCDEMO. |
| wine | WINE Wine demographic data set for PCA example. |
| wineregion | Metal Composition of Wines for classification by region. |
| redbeerdata.xls | REDBEERDATA.XLS Example spreadsheet for "Intro to MATLAB". |
| areadrdemtext.txt | AREADRDEMTEXT.TXT Text file used by AREADRDEMO. |
| xclreadrdata.txt | XCLREADRDATA.TXT Text file used by XCLREADRDEMO. |
How to Load Demo Data
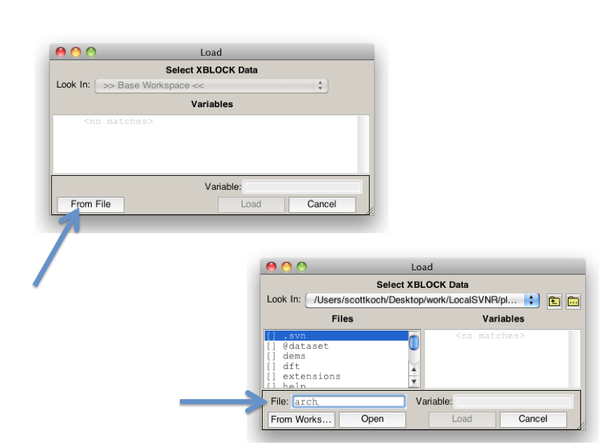
For MAT files, the easiest way to load demo data is using the Load Dialog Box:
- From the file menu Load Data (or Import Workspace/MAT File).
- When the dialog box appears click the From File button.
- Type the name of the demo MAT file to loaded and hit the return key.
- Select the variables to be loaded and click the Load button.
(Sub topic of PLS_Toolbox_Topics)
