Working with false-color images: Difference between revisions
imported>Benjamin (Created page with "==Single-layer False-color image== When viewing image-data such as scores of a PCA model built on an image, the scores are formatted with accordance to the original image-dat...") |
imported>Benjamin No edit summary |
||
| Line 7: | Line 7: | ||
You may change the | === Adjusting the Colormap === | ||
:1) Clicking on the | |||
You may change the Colormap by: | |||
:1) Clicking on the ‘Insert Colorbar’ button | |||
:2) Right clicking on the colorbar, select ‘standard colormaps’ and then select one of predefined colormaps (such as ‘jet’ or ‘hot’). | :2) Right clicking on the colorbar, select ‘standard colormaps’ and then select one of predefined colormaps (such as ‘jet’ or ‘hot’). | ||
| Line 22: | Line 24: | ||
[[image:T1267-f3.jpg|350px]] | [[image:T1267-f3.jpg|350px]] | ||
===Selecting variables by threshold=== | |||
To select variables based in their respective values, right click on the image and select ‘Image Histogram’, a window will appear which displays a histogram of pixels in the image. Click on the ‘Select pixels from histogram’ in the upper left corner then select a region of pixels (click & drag). | To select variables based in their respective values, right click on the image and select ‘Image Histogram’, a window will appear which displays a histogram of pixels in the image. Click on the ‘Select pixels from histogram’ in the upper left corner then select a region of pixels (click & drag). | ||
| Line 39: | Line 43: | ||
To Change the Color order, in the Plot Controls window: View -> Settings. | To Change the Color order, in the Plot Controls window: View -> Settings. | ||
A setting window will open, and under ‘Image settings’ there is a field called ‘imagegunorder’ with several number (default: 1 2 3) clicking on these numbers will open a drop down selection for a desired reordering of the layers which resulting in changing their respective colors. Meaning, 1 2 3: first layer is colored red, second is colored green, and third is colored blue. Likewise, 3 2 1: third layer is colored red, second is colored green, and the first is colored blue. | A setting window will open, and under ‘Image settings’ there is a field called ‘imagegunorder’ with several number (default: 1 2 3) clicking on these numbers will open a drop down selection for a desired reordering of the layers which resulting in changing their respective colors. Meaning, 1 2 3: first layer is colored red, second is colored green, and third is colored blue. Likewise, 3 2 1: third layer is colored red, second is colored green, and the first is colored blue. | ||
Revision as of 14:29, 12 May 2017
Single-layer False-color image
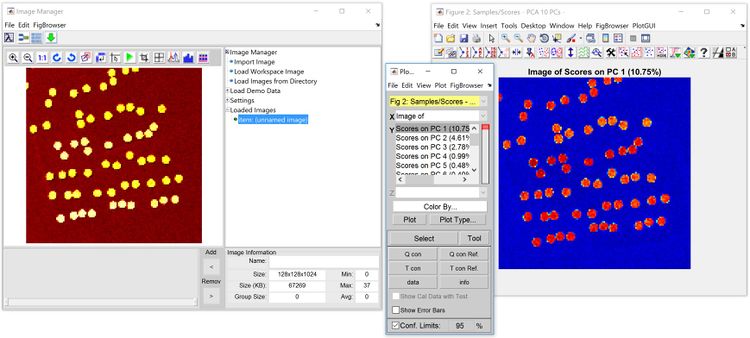
When viewing image-data such as scores of a PCA model built on an image, the scores are formatted with accordance to the original image-data. When displaying the scores of a single PC (a single layer image), the results are displayed in false-colors. Shown in the figure below, on the left is the original image in the Image Manager window (for reference), on the right is the scores of the first component of a PCA model built on the data, note that the colormap for the scores is set to ‘jet’.
Adjusting the Colormap
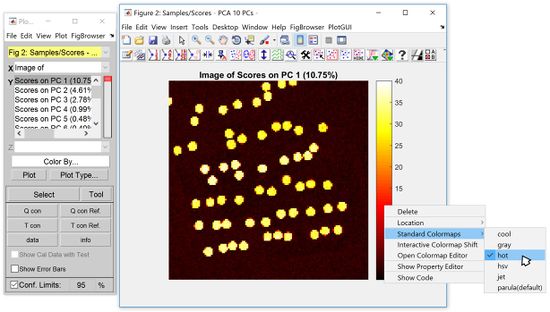
You may change the Colormap by:
- 1) Clicking on the ‘Insert Colorbar’ button
- 2) Right clicking on the colorbar, select ‘standard colormaps’ and then select one of predefined colormaps (such as ‘jet’ or ‘hot’).
You may choose ‘open colormap editor’ and create and customize your own colormap. Note that in this false-color mode, the color corresponds to the magnitude of the scores at each pixel.
You may also choose to interactively adjust the colormap by right clicking on it and select ‘Interactive Colormap Shift’, then by hovering the curser at the top or the bottom of the colormap you can click & drag (the mouse cursor will change) to adjust the colormap shift as desired.
Selecting variables by threshold
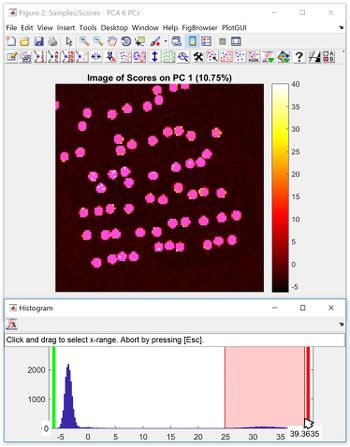
To select variables based in their respective values, right click on the image and select ‘Image Histogram’, a window will appear which displays a histogram of pixels in the image. Click on the ‘Select pixels from histogram’ in the upper left corner then select a region of pixels (click & drag).
Two/Three-layer False-color image overlay
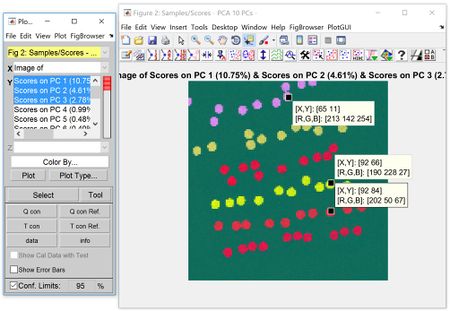
When displaying two or three images in an overlay (such as scores from a PCA model), the false-color mode changes from colormap to “RGB mode” in order to accommodate the multiple layers. In “RGB mode”, the colors displayed on the image overlay reflect magnitude of each overlay/score. The data cursor tool can be used to view these RGB values at a specified location/index.
To Change the Color order, in the Plot Controls window: View -> Settings.
A setting window will open, and under ‘Image settings’ there is a field called ‘imagegunorder’ with several number (default: 1 2 3) clicking on these numbers will open a drop down selection for a desired reordering of the layers which resulting in changing their respective colors. Meaning, 1 2 3: first layer is colored red, second is colored green, and third is colored blue. Likewise, 3 2 1: third layer is colored red, second is colored green, and the first is colored blue.
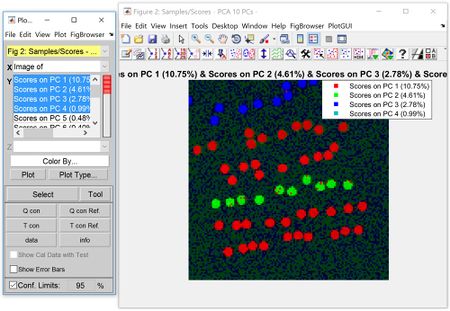
Multi-layer (4+) False-color image overlay
When displaying more than three overlays the color mode changes to correspond to standard plot color order (so they correspond to overlaid loadings plots, for example). Meaning, the false-color displayed is the component with the highest value/score.
