Variableselectiongui
Jump to navigation
Jump to search
Introduction
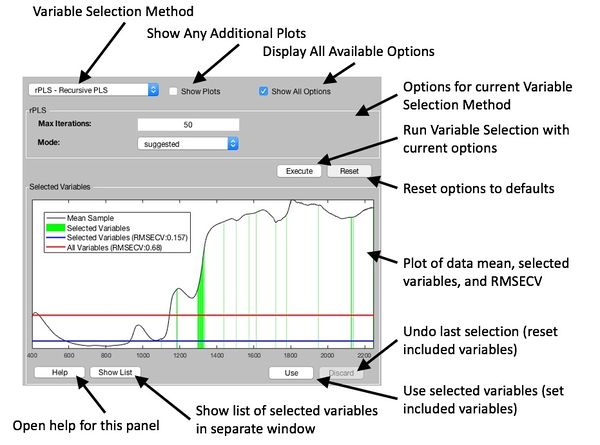
The Variable Selection panel contains an interface to several methods for performing variable selection. The goal is to find subsets of variables that improve predictions when compared to using all variables. This interface has several different methods available. Finding the best method and options settings will take some experimentation. Use links below to find more information on particular methods.
Methods
- Automatic (VIP or sRatio)
- GA - Genetic Algorithm
- iPLS - Interval PLS
- rPLS - Recursive PLS
- sRatio - Selectivity Ratio
- VIP - Variable Importance in Projection
Work Flow
- Select a Method - Select a method from the drop-down menu. Options for the method will be displayed. If a previous calculation has been done, the results of it will be displayed.
- Adjust Options - By default, a simplified set of options are displayed. If the Show All Options checkbox is selected then all available options will be displayed. Depending on the options set, a particular method can take an extended amount of time to complete. For example, decreasing the window width in GA will increase the amount of time it takes to complete. See documentation for more details on optional settings. Clicking Reset button will reset all options to default values.
- Run Variable Selection - Clicking the Execute button will run the current variable selection method with values specified in the options. A waitbar will be displayed indicating the method is running. Some methods will display a waitbar with a message indicating it can be closed to cancel execution. NOTE: It can take some time for the method to finish a calculation loop and identify the user has canceled. If Show Plots is checked then any additional plots will be displayed in separate windows. This is useful for GA as it will show progress of the calculation.
- View Results - When a calculation is complete the selected variables will be displayed under a plot of the data mean as green bars. Two lines are displayed indicating the relative RMSECV values. The red line is the best RMSECV for all variables and the blue line is the best RMSECV for selected variables. These lines are scaled to the max RMSECV with all variables included.
- Use Selected Variables - To use the selected variables click the Use button and the current selection will become the "included" variables of the current dataset (.include{2} field). You can undo by clicking the Discard button.
Other Features
- GA Window - The GenAlg (GA) Window can be displayed clicking the GA Window button. This will give access to all options. Values set on the panel will be reflected in the GA Window.
- Show List - The Show List button will open a separate window listing the indices of the selected variables.
- Help - The Help button displays this page.
- Cross Validation Settings - For methods that use cross validation settings (e.g., maxlv and splits), these settings are pulled from the current values in the Cross Val window.
