Projdemo: Difference between revisions
Jump to navigation
Jump to search
imported>Chuck (New page: ===Purpose=== Provides a visual demonstration of the differences between MLR, PCR and PLS regression. ===Synopsis=== : projdemo ===Description=== This function runs a demonstration th...) |
imported>Chuck |
||
| Line 9: | Line 9: | ||
===Description=== | ===Description=== | ||
This function runs a demonstration that compares the regression methods MLR, PCR and PLS using a synthetic data set consisting of a 2-variable x-block and a 1-variable y-block. Visual-based comparisons of these 3 methods are made, using 3-D | This function runs a demonstration that compares the regression methods MLR, PCR and PLS using a synthetic data set consisting of a 2-variable x-block and a 1-variable y-block. Visual-based comparisons of these 3 methods are made, using 2-D and 3-D plots. | ||
There are no inputs, outputs, or options associated with this function. | There are no inputs, outputs, or options associated with this function. | ||
Latest revision as of 15:37, 9 October 2008
Purpose
Provides a visual demonstration of the differences between MLR, PCR and PLS regression.
Synopsis
- projdemo
Description
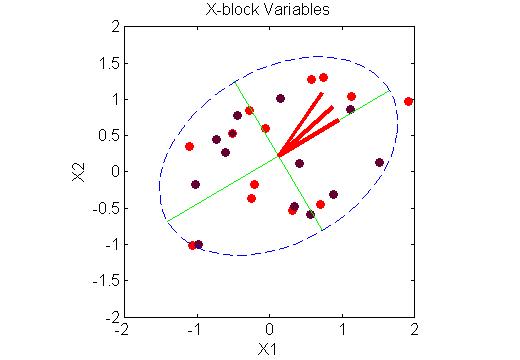
This function runs a demonstration that compares the regression methods MLR, PCR and PLS using a synthetic data set consisting of a 2-variable x-block and a 1-variable y-block. Visual-based comparisons of these 3 methods are made, using 2-D and 3-D plots.
There are no inputs, outputs, or options associated with this function.

