imported>Jeremy |
imported>Mathias |
| Line 1: |
Line 1: |
| __TOC__
| | ===Purpose=== |
|
| |
|
| [[TableOfContents|Table of Contents]] | [[AnalysisWindow_Layout|Previous]] | [[AnalysisWindow_Toolbar|Next]]
| | GUI for designating column/row data types in incoming data. Allows user to specify a column or row as labels, class sets, or axisscale or data. |
|
| |
|
| ===Analysis window main menu=== | | ===Synopsis=== |
|
| |
|
| The Analysis window main menu is set up in a standard Windows menu format with commands grouped into menus ([[#File menu|File]], [[#Edit menu|Edit]], [[#Preprocess menu|Preprocess]], [[#Analysis menu|Analysis]], [[#Tools menu|Tools]], Help and [[Solo_CommonApplicationFeatures#FigBrowser|FigBrowser]]) across the menu bar. Some of these commands are available in other areas of the application.
| | : [ctypes, rtypes] = importtool(data); |
| | : [ctypes, rtypes] = importtool(data,options); |
|
| |
|
| :''Analysis window main menu''
| | ===Description=== |
|
| |
|
| ::[[Image:Analysis_window_main_menu.png|296x20px]]
| | Allows user to identify data type (data, class, axisscale, include, and ignore) fields (row and columns) in a data matrix. |
|
| |
|
| | ===Options=== |
|
| |
|
| ====File menu==== | | options = a structure array with the following fields: |
|
| |
|
| The File menu provides access to loading, importing, saving, and exporting data and models. For more information on these topics see:
| | * '''fields''': Nx2 cell array, first column is field name, second column is color to use. |
| :* [[WorkspaceBrowser_ImportingData| Loading and Importing Data]]
| |
| :* [[Exporting Models]]
| |
|
| |
|
| ====Edit menu====
| |
|
| |
|
| The Edit menu provides access to the [[DataSet Editor]] for editing and [[Plot Controls]] for plotting of the calibration and validation data.
| | ==Examples== |
|
| |
|
| The Edit menu also provides control over various interface and analysis options through the Edit > Options menu:
| |
|
| |
|
| :* Method Options - Opens the Options dialog box which lists options for controlling the settings that are specific to the currently selected analysis method such as confidence limits settings, algorithm selections, and constraints. Some analysis methods have more setting options than others. See [[Solo_CommonApplicationFeatures|Options dialog box]].
| | Here we import a csv file by dragging the file into the browse window. |
| :* Analysis GUI Options - Opens the Options dialog box which lists options for the currently opened Analysis window, including the maximum number of factors displayed, the font size for the Control pane, and the display in the Analysis Flow Chart pane. See [[Solo_CommonApplicationFeatures|Options dialog box]].
| |
| :* Model Cache Settings - Allows you to turn model caching on and off and adjust various other aspects of the model cache. See [[AnalysisWindow_ModelCachepane|Analysis window Model Cache pane]].
| |
| :* Default Plots - Opens the Default Plots dialog box in which you can adjusting default Scores plots for given methods.
| |
| :* Window Docking Settings - Opens the Window Docking Settings dialog box which you use to adjust the docking behavior of your Solo windows. See [[WorkspaceBrowser_Preferences#To_specify_the_Window_docking_settings|To specify the Window docking settings]].
| |
| :* Preferences (Expert) - Opens a Preferences (Expert) window which you use to override all values for all Solo options. See [[Expert Preferences GUI]].
| |
|
| |
|
| ====Preprocess menu====
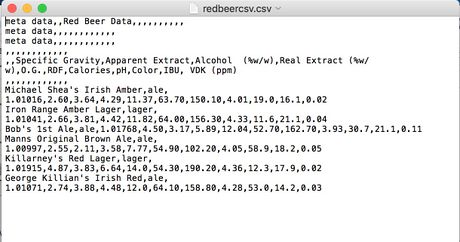
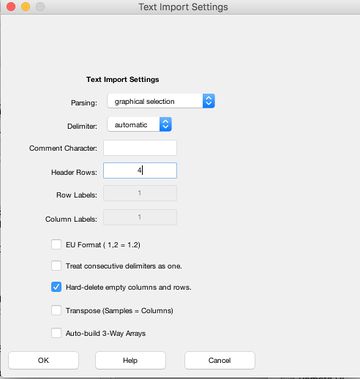
| | Taking a look at the file we are attempting to import, we see that we have 4 lines of meta data + blank lines, so we set the 'header rows' field to 4 in the text import settings window. The automatic delimiter detection is being used in this example, however the user may force the use of a specific delimiter by selecting it in this window. |
|
| |
|
| The Preprocess menu provides access to the [[ModelBuilding_PreProcessingMethods|preprocessing window]] from which you can modify the data pre-treatment being performed on the data. This can be one of the three simple preprocessing methods (None, Mean Centering, or Autoscale) or custom preprocessing.
| |
|
| |
|
| Once preprocessing has been selected, you can make the current preprocessing the default for the x-block or y-block by selecting the "Use as default" menu item from the x-block or y-block menus, respectively. Preprocessing can also be saved or loaded from a MAT file or the workspace.
| | [[Image:csv_examp.jpg||460px|]] |
| | [[Image:Text_import1.jpg||360px|]] |
|
| |
|
| The Preprocess menu also provides access to the [[Declutter_Settings_Window|Clutter functions]] of Analysis as well as plotting of the preprocessed data.
| |
|
| |
|
| ====Analysis menu====
| |
|
| |
|
| The [[Analysis Menu]] provides access to various analysis methods within the GUI. More details on these methods can be found [[Analysis_Menu|here]]
| |
|
| |
|
| ====Tools menu====
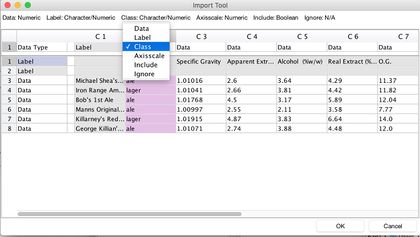
| | The importool will attempt to automatically detect label columns. Here the first column containing the names of beers has been automatically detected as a label column. The third column, containing class information of either 'ale' or 'lager' has also been automatically detected as a label column. To set this column to a class column, click where it says 'label' underneath C2 and select class. The importer will now populate the datasets'class field with the information contained within this second column. |
|
| |
|
| The Tools menu contains a number of tools which you can use to investigate and gather information about the currently loaded data and to assess a model's performance.
| |
|
| |
|
| :''Tools menu''
| |
|
| |
|
| :* Cross-Validation - Sets or modifies the settings related to cross-validation of models. See [[Tools_Cross-Validation|Cross-Validation]].
| | [[Image:importtool1.jpg||420px|]] |
| :* Orthogonalize Model - Provides orthogonalized PLS and PLSDA models (also known as OPLS and OPLSDA models) in which all y-correlated information compressed in the first component. See [[Orthogonalizepls]]. | | |
| :
| | |
| :* Show Details - View statistics and model building details for the currently built model.
| | |
| :* Report Writer - Generate an HTML, PowerPoint, or Word Document describing the current model including any plots which are currently open and associated with that model. See [[Reportwriter]].
| | ===See Also=== |
| :* Test Model Robustness - Assess model sensitivity to typical interferences. See [[Tools_ModelRobustness|Test Model Robustness]].
| | |
| :* Permutation Test - Performs a y-block reordering and calculates an estimation of the error levels expected for random correlation. See [[Tools:_Permutation_Test|Permutation Test]].
| | [[parsemixed]] |
| :* Correlation Map - Shows the degree of correlation among the variables. See [[Tools_CorrelationMap|Correlation Map]].
| |
| :* Estimate Factor SNR - Provides an estimate of the number of significant PCA factors for the current data using the [[Estimatefactors]] algorithm.
| |
| :
| |
| :* View Cache - Changes the model cache viewing options. See [[Model Cache]]
| |
| :* Toolbar - Provides access to all toolbar items via menu controls
| |


