Key GUIs
Introduction
Most of the higher-level data analysis tools can be accessed through Graphical User Interfaces (GUIs) in PLS_Toolbox. In many cases a GUI can make data analysis faster and easier to perform and interpret than using the command line analogs.
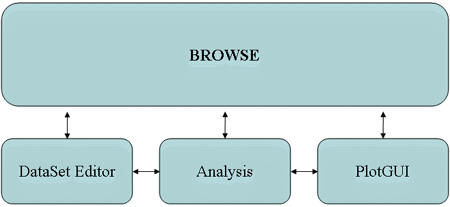
PLS_Toolbox is organized around 4 main GUI tools. Each tool is dedicated to a specific step in the data analysis process.
- The Browse GUI is the PLS_Toolbox "desktop" environment. Here one has access to all loaded data, available analysis methods, the DataSet Editor, and other top level tools. With its "drag and drop" functionality, a user can quickly begin a number of data analysis tasks.
- The DataSet Editor is the primary data-handling GUI in PLS_Toolbox. It provides a variety of functions and tools for loading, editing, and saving data. As its name suggests, the object used in PLS_Toolbox for managing data is the DataSet Object.
- The Analysis GUI is the core interface with PLS_Toolbox data modeling and exploration functions. This is where you will create and explore your models.
- The PlotGUI interface is the principal data visualization tool for PLS_Toolbox. It provides a vast number of tools for labeling, manipulating, and publishing plots generated using PLS_Toolbox.
Browse GUI
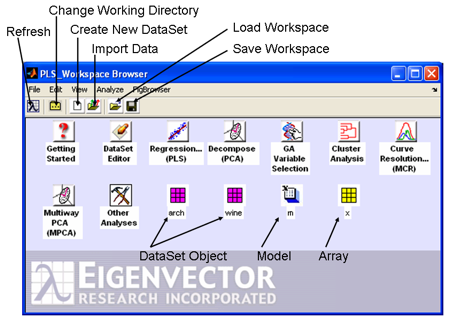
The Browse window shows icons for tools and objects in the PLS_Toolbox workspace. Each analysis icon opens its respective interface in the named mode (e. g., Decompose will open the Analysis window with PCA already selected). The browse environment is "drag and drop" enabled so you can click on a DataSet icon, drag it over an analysis icon, and release the click to start the analysis. This will open the Analysis window with the method pre-selected and load the data. Likewise, you can drag an existing data or model icon from the browse window over to an Analysis window and "drop" the data /model into an ongoing analysis.
Analysis
The Analysis application provides a common interface for several popular PLS_Toolbox analysis functions, including:
- PCA
- Purity
- MCR
- PARAFAC
- MPCA
- CLUSTER
- PLS
- PCR
- MLR
- CLS
- KNN
- PLSDA
- SIMCA
The interface allows the flexibility to switch between analysis methods (for a given type of data) and will help you manage your developed models. There are various useful tools integrated into the application that can be accessed through menus and associated GUIs.
The Analysis interface can be started from the Browse GUI (when using Solo) or from the command line using the command analysis.
>> analysis
It can also be started with a default analysis method selected by typing the PLS_Toolbox command for the specific analysis of interest without any input arguments. For example, the command below starts the analysis interface preset to the PCA analysis method.
>> pca
Main Window:
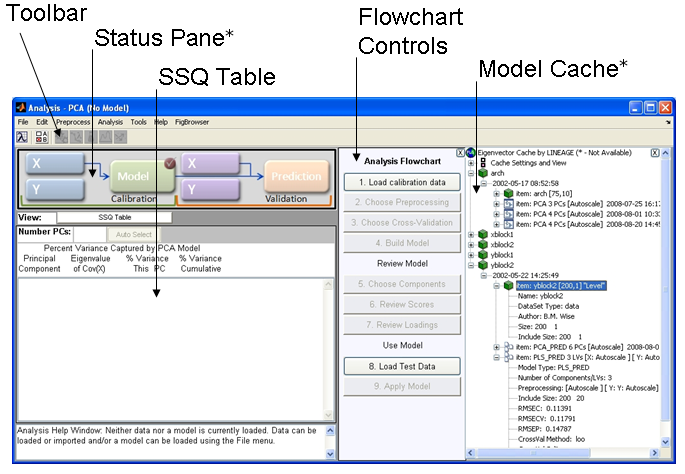
The main Analysis window has a layout with five basic areas.
- Toolbar - The Toolbar contains buttons specific to a particular analysis method.
- Status Pane - The Status Pane shows information for the currently loaded items (hoovering the mouse over a particular item will display a temporary window containing specific information).
- SSQ Table - For analysis methods that generate statistics, the SSQ window will display statistics and allow you to manipulate the number of components or factors to be modeled. The area directly above the SSQ table contians buttons specific to an analysis allowing you to change information displayed in the SSQ Table area.
- Flowchart - Displays an itemized list of buttons that outline the steps typically needed for the current analysis.
- Model Cache - When turned on, the Model Cache will keep track of and display all of the models, data, and predictions created during the data analysis process.
Menu items allow access to common I/O functionality, data manipulation, and analysis set-up. Menu items are available both in the main window menubar and as context menus (right-click menus) within the Status Pane and Model Cache. Some menu items are available at all times, others will be disabled depending on the loaded data and model type. Notice that when no DataSet Object or model is loaded, all items except for loading functions are disabled in the menus. As you load data and create models you’ll find appropriate menu items enabled or disabled.
At the bottom of the figure is a Help Window that displays suggestions for the next step of an analysis. It is meant as a guide for novice users and can be turned off by right-clicking on the window.
DataSet Editor
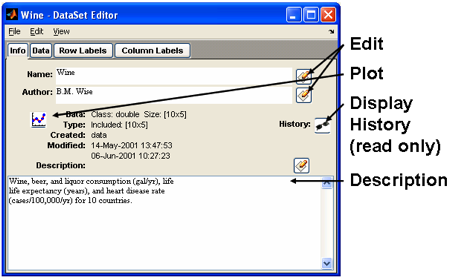
The DataSet Editor (DSE) is an interface for editing the contents of a DataSet Object. Using the Editor can be easier and quicker than manipulating a DataSet Object from the command line. The demonstration below will run through some of the common functions of the DSE.
Start an empty DataSet Editor by using the MATLAB command below or by clicking the DataSet Editor icon in the Browser:
>> editds
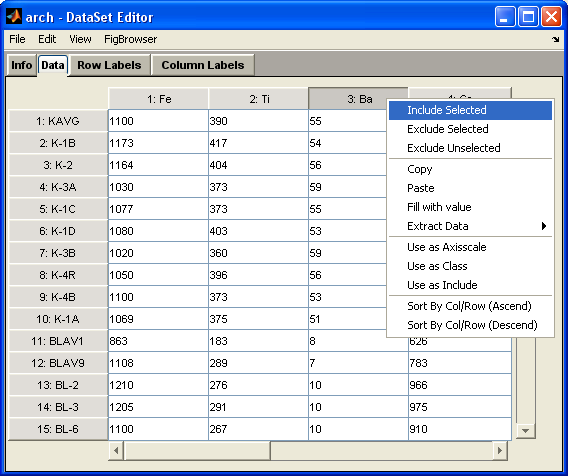
As with the Analysis GUI, menu items are available both in the main window menubar and as context menus (right-click menus). Displayed below is an example of the context menu available for columns in the data tab, similar menus appear for headers located in label tabs:
PlotGUI
PlotGUI is the primary plotting tool in PLS_Toolbox/Solo. PlotGUI is configured to have a single small controls interface, Plot Controls, which contains all of the tools necessary to manipulate a particular plot. At any time there may be several plots (figures) open under "control" of PlotGUI but only one Plot Controls window. Selecting a plot and clicking on its "gray space" (the gray margin area around the actual plot axes) will automatically bring the Plot Controls interface to the front.
The 'plotgui' Plot Controls window can be invoked from the MATLAB command line by typing plotgui. It is also used by other PLS_Toolbox functions and can be accessed from any of a number of different interfaces including the workspace Browser.
>> plotgui
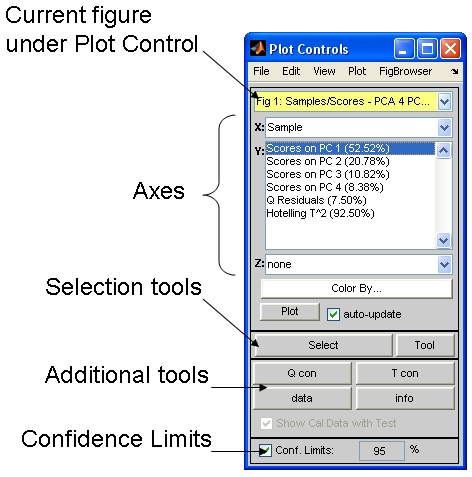
PlotGUI Plot Controls Figure
At the top of the Plot Controls window is a Figure Selector pull-down menu, which indicates the current figure being controlled. Below this are three Axis Menus, one for each of the x, y and z axes of a plot. Multiple y-axis items can be simultaneously plotted by holding down the Control key when making selections (As these plots can get confusing, a legend can be added to the plot by selecting Insert/Legend from the menus on the plot itself). Clicking the Select button will allow you to surround and select points in the current plot. Additional plotting tools are added just below Select. When Confidence Limits are available they can be adjusted using the controls near the bottom of the Plot Controls.
Managing Windows In PLS_Toolbox and Solo
Managing numerous windows can be challenging, especially when you have limited screen space. PLS_Toolbox/Solo provides several tools for helping with this problem.
The figbrowser utility (short for "Figure Browser") is available as a menu item at the top of all open figures.
Although the FigBrowser utility can help you manage figures (see below), you can also set the Browser to display figures using setplspref (see setplspref and getplspref in the manual for more information) from the command line using the following command: >> setplspref('browse', 'viewfigures', 'true') Once you’ve set the preferences, you’ll have to restart the Browser for the new preferences to take affect.
