Faq how do I add confidence ellipses around groups of samples: Difference between revisions
imported>Lyle (Created page with "===Issue:=== How do I add confidence ellipses around groups of samples? ===Possible Solutions:=== Version 4.1 introduces class-based confidence ellipses. Any figure which i...") |
imported>Lyle No edit summary |
||
| Line 5: | Line 5: | ||
===Possible Solutions:=== | ===Possible Solutions:=== | ||
Version 4.1 introduces class-based confidence ellipses. Any figure which includes classes (see our [[Faq_assign_classes_for_samples_in_a_DataSet | FAQ item about setting classes in data]]) can now have statistically-based confidence ellipses drawn around each class. In the '''Plot Controls''' figure, select the '''View/Classes/Outline Class Groups''' menu. There you will find various options to enclose classes including connecting the points which are on the border of the class cluster (Border Points) or drawing a confidence ellipse around each class. | Version 4.1 introduces class-based confidence ellipses. Any figure which includes classes (see our [[Faq_assign_classes_for_samples_in_a_DataSet | FAQ item about setting classes in data]]) can now have statistically-based confidence ellipses drawn around each class. In the '''Plot Controls''' figure, select the '''View/Classes/Outline Class Groups''' menu. There you will find various options to enclose classes including connecting the points which are on the border of the class cluster (Border Points) or drawing a confidence ellipse around each class. The confidence ellipse option calculates the Hotelling's T<sup>2</sup> confidence ellipse around each class. The particular confidence level can be set using the same menu. Note that class zero samples never have a confidence ellipse drawn around them because class zero is considered "unknown" (i.e. no class). To get an ellipse around these points, they must be assigned a non-zero class number. | ||
There are two ways to show confidence ellipses: | There are two ways to show confidence ellipses: | ||
Latest revision as of 09:42, 26 December 2018
Issue:
How do I add confidence ellipses around groups of samples?
Possible Solutions:
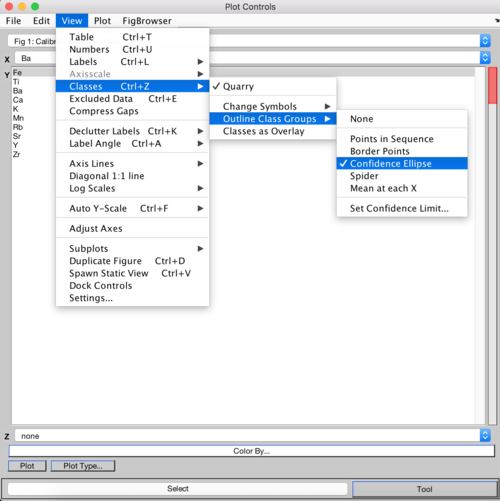
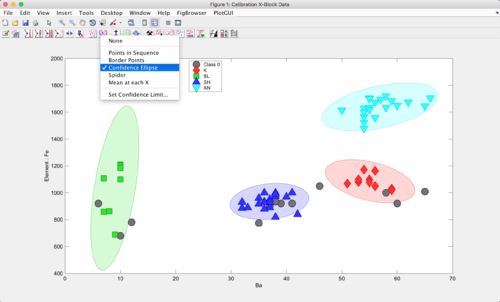
Version 4.1 introduces class-based confidence ellipses. Any figure which includes classes (see our FAQ item about setting classes in data) can now have statistically-based confidence ellipses drawn around each class. In the Plot Controls figure, select the View/Classes/Outline Class Groups menu. There you will find various options to enclose classes including connecting the points which are on the border of the class cluster (Border Points) or drawing a confidence ellipse around each class. The confidence ellipse option calculates the Hotelling's T2 confidence ellipse around each class. The particular confidence level can be set using the same menu. Note that class zero samples never have a confidence ellipse drawn around them because class zero is considered "unknown" (i.e. no class). To get an ellipse around these points, they must be assigned a non-zero class number.
There are two ways to show confidence ellipses:
- Using Plot Controls window
- Using ''Connect Classes'' button


Still having problems? Please contact our helpdesk at helpdesk@eigenvector.com