imported>Jeremy |
imported>Donal |
| Line 1: |
Line 1: |
| __TOC__
| | ==Classification Information in Scores Plot== |
| [[TableOfContents|Table of Contents]] | [[Solo_CommonApplicationFeatures|Previous]] | [[WorkspaceBrowser_Preferences|Next]]
| |
|
| |
|
| ==Workspace Browser== | | It is possible to view results of predicting classification of X-block samples in the Scores Plot when using analysis methods PLSDA, SVMDA, KNN or SIMCA. |
| | These analysis methods determine the probability that a sample belongs to each of the possible classes. |
| | Based on this the user can view plots showing the most probable class of each sample according to the model predictions. The "Plot Controls" window for the scores plot shows several classification fields among the choices of X or Y fields to plot. For example, setting the Plot Controls X field = "Sample" and the Y field = "Class Pred Most Probable" will show the most probable class for each sample in the Scores Plot. |
|
| |
|
| The Workspace Browser opens automatically when you launch Solo.
| | In this "Class Pred Most Probable" case the Y axis ranges over class numbers and a sample belonging to class = 2 is shown at (x,y) = (sample number, 2). Points are drawn with distinct |
| | symbols for each class and inserting a figure legend shows the class ID associated with each symbol. |
|
| |
|
| :''Workspace Browser''
| | There is always a most likely class for a sample to belong to but it is possible that the sample is not well modeled and has low |
| | probabilities for all classes. Or it is possible that two classes are similar and a sample belonging to one of them will also |
| | have a high predicted probability of belonging to the second class too. In these situations there can be little confidence in the "most probable" |
| | class prediction. The choice labeled "Class Pred Strict" addresses these situations by assigning the sample to the "unknown" class (zero) if |
| | the most likely class probability is less than 0.5 or if two or more classes have probability of greater than 0.5 for the sample. |
|
| |
|
| ::
| | The predicted probability that a sample belongs to a particular class, for example the class named <classID>, is available under the |
| ::
| | label "Class Pred Probability <ClassID>". A sample belonging to this class will have value = 1, or 0 otherwise. |
|
| |
|
| ::[[Image:WorkspaceBrowser_Layout.05.1.1.jpg|543x340px]]
| | The label "Class Pred Member <ClassID>" identifies samples which have predicted probability > 0.5 of belonging to class "<ClassID>". |
| ::
| | These samples will have value = 1, or 0 otherwise. |
| | Note that label "Class Pred Member - unassigned" identifies samples which were not assigned to any class because no predicted probability |
| | was greater than 0.5. |
|
| |
|
| The Workspace Browser is your starting interface for Solo. The interface provides quick access to all of the data analysis tools. The browser also serves as your "scratch pad" in Solo-you can pre-process data for analysis in the browser, or you can import data into the browser and then manipulate the data prior to analysis. The Solo Workspace Browser has four major components-the [[WorkspaceBrowser_Layout#title bar|title bar]], the [[WorkspaceBrowser_Layout#main menu|main menu]], the [[WorkspaceBrowser_Layout#toolbar, |toolbar, ]]and the [[WorkspaceBrowser_Layout#base workspace|base workspace]].
| | Finally, label "Misclassified" identifies samples where the predicted "Class Pred Strict" does not agree with the sample's actual class. |
| | For SIMCA and PLSDA the actual class |
| | could include more than one class and the sample is misclassified if its "Class Pred Member <ClassID>" do not correctly predict the actual class(es). |
| | If the sample's actual class is unknown then the sample will not be identified as as misclassified. |
|
| |
|
| ===Title bar=== | | ==Example of Classification Information in Scores Plot== |
|
| |
|
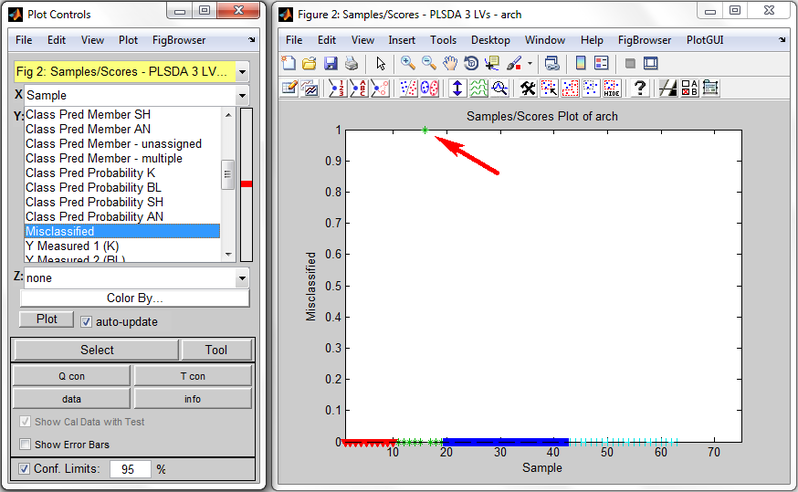
| The phrase "Solo Workspace Browser" appears in the title bar at the top of the Solo Workspace Browser, as well as the standard Window Minimize, Maximize, and Close buttons. | | Shown below is an example Scores Plot from PLSDA run on the arch dataset. In the Plot Controls window (on left) are shown some of the classification fields which may be plotted. The X field is set to "Sample" and the Y field is set to "Misclassified". The Scores Plot shows that all X samples have value 0 (NOT misclassified) except for one sample, the 16th, which has value 1, indicating it is misclassified. Looking at the "Class Pred Most Probable" field shows this sample is correctly predicted as belonging to class 2 ("BL"). Looking at "Class Member Pred K" and "Class Member Pred BL" both show sample 16 belonging, meaning that sample 16 belongs to each of these classes with probability > 0.5. Sample 16 actually only belongs to class "BL" as shown by Y="Class Measured 2 (BL)", and therefore it is considered to be misclassified. |
|
| |
|
| ===Main menu===
| | <gallery widths="798px" heights="547px" perrow="1"> |
| | | File:Scoresplot_classification.png|Scores Plot (right) and its Plot Controls (left) for PLSDA on arch dataset. |
| The main menu is set up in a standard Windows format with commands grouped into menus (File, Edit, View, Analyze, Help and FigBrowser) across the menu bar. Some of these menu commands are available in other areas of the browser.
| | </gallery> |
| | |
| '''Note:''' The File > Remote Automation command allows the control of Solo by another program. If Solo is running, certain third party programs can connect to Solo and directly "dump" data into Solo and even start an Analysis window with the data loaded. This prevents you from having to carry out the manual process of opening a file, importing the file, and bringing the file into the Analysis window. Contact Eigenvector for assistance with this function.
| |
| | |
| ===Toolbar===
| |
| | |
| The toolbar provides quick access to some of the most commonly used Workspace Browser functions. Place your mouse pointer over a toolbar button to open tooltip text for the button. Some of these functions are available in other areas of the browser.
| |
| | |
| ::
| |
| ::
| |
| <table style="border-collapse: collapse; margin-bottom: 12.0pt; margin-left: 0pt; margin-right: 0pt; margin-top: 3.0pt; padding-bottom: 1pt; padding-left: 6pt; padding-right: 6pt; padding-top: 6pt; text-align: left; width: 405.00072pt;" cellspacing="0" summary=""> | |
| | |
| <tr>
| |
| <td style="background-color: #E8E8E8; border-bottom-color: #000000; border-bottom-style: solid; border-bottom-width: 1px; border-left-color: #000000; border-left-style: solid; border-left-width: 1px; border-right-color: #000000; border-right-style: solid; border-right-width: 1px; border-top-color: #000000; border-top-style: solid; border-top-width: 1px; padding-bottom: 1pt; padding-left: 6pt; padding-right: 6pt; padding-top: 6pt; vertical-align: top; width: 48.74976pt;">
| |
| | |
| '''Button'''
| |
| </td>
| |
| <td style="background-color: #E8E8E8; border-bottom-color: #000000; border-bottom-style: solid; border-bottom-width: 1px; border-left-color: #000000; border-left-style: solid; border-left-width: 1px; border-right-color: #000000; border-right-style: solid; border-right-width: 1px; border-top-color: #000000; border-top-style: solid; border-top-width: 1px; padding-bottom: 1pt; padding-left: 6pt; padding-right: 6pt; padding-top: 6pt; vertical-align: top; width: 356.25096pt;">
| |
| | |
| '''Function'''
| |
| </td>
| |
| </tr>
| |
| <tr>
| |
| <td style="border-bottom-color: #000000; border-bottom-style: solid; border-bottom-width: 1px; border-left-color: #000000; border-left-style: solid; border-left-width: 1px; border-right-color: #000000; border-right-style: solid; border-right-width: 1px; border-top-color: #000000; border-top-style: solid; border-top-width: 1px; padding-bottom: 1pt; padding-left: 6pt; padding-right: 6pt; padding-top: 6pt; vertical-align: top;">
| |
| | |
| [[Image:Refresh_Browser_icon.png|18x18px]]
| |
| ::
| |
| | |
| </td>
| |
| <td style="border-bottom-color: #000000; border-bottom-style: solid; border-bottom-width: 1px; border-left-color: #000000; border-left-style: solid; border-left-width: 1px; border-right-color: #000000; border-right-style: solid; border-right-width: 1px; border-top-color: #000000; border-top-style: solid; border-top-width: 1px; padding-bottom: 1pt; padding-left: 6pt; padding-right: 6pt; padding-top: 6pt; vertical-align: top;">
| |
| Refresh Browser icon - Refreshes the current display for the Workspace Browser.
| |
| </td>
| |
| </tr>
| |
| <tr>
| |
| <td style="border-bottom-color: #000000; border-bottom-style: solid; border-bottom-width: 1px; border-left-color: #000000; border-left-style: solid; border-left-width: 1px; border-right-color: #000000; border-right-style: solid; border-right-width: 1px; border-top-color: #000000; border-top-style: solid; border-top-width: 1px; padding-bottom: 1pt; padding-left: 6pt; padding-right: 6pt; padding-top: 6pt; vertical-align: top;">
| |
| | |
| | |
| [[Image:Change_working_directory_icon.png|20x16px]]
| |
| ::
| |
| | |
| </td>
| |
| <td style="border-bottom-color: #000000; border-bottom-style: solid; border-bottom-width: 1px; border-left-color: #000000; border-left-style: solid; border-left-width: 1px; border-right-color: #000000; border-right-style: solid; border-right-width: 1px; border-top-color: #000000; border-top-style: solid; border-top-width: 1px; padding-bottom: 1pt; padding-left: 6pt; padding-right: 6pt; padding-top: 6pt; vertical-align: top;">
| |
| Change Working Directory icon - Opens the Browse for Folder dialog box which you use to browse to and select a different working directory (the directory that is associated with the current Workspace Browser process.)
| |
| </td>
| |
| </tr>
| |
| <tr>
| |
| <td style="border-bottom-color: #000000; border-bottom-style: solid; border-bottom-width: 1px; border-left-color: #000000; border-left-style: solid; border-left-width: 1px; border-right-color: #000000; border-right-style: solid; border-right-width: 1px; border-top-color: #000000; border-top-style: solid; border-top-width: 1px; padding-bottom: 1pt; padding-left: 6pt; padding-right: 6pt; padding-top: 6pt; vertical-align: top;">
| |
| | |
| [[Image:New_Dataset_icon.png|20x20px]]
| |
| ::
| |
| | |
| </td>
| |
| <td style="border-bottom-color: #000000; border-bottom-style: solid; border-bottom-width: 1px; border-left-color: #000000; border-left-style: solid; border-left-width: 1px; border-right-color: #000000; border-right-style: solid; border-right-width: 1px; border-top-color: #000000; border-top-style: solid; border-top-width: 1px; padding-bottom: 1pt; padding-left: 6pt; padding-right: 6pt; padding-top: 6pt; vertical-align: top;">
| |
| New Dataset icon - Opens the New DataSet dialog box which you use to specify the size and initial value for a new DataSet, which is the object used in Solo for managing data.
| |
| </td>
| |
| </tr>
| |
| <tr>
| |
| <td style="border-bottom-color: #000000; border-bottom-style: solid; border-bottom-width: 1px; border-left-color: #000000; border-left-style: solid; border-left-width: 1px; border-right-color: #000000; border-right-style: solid; border-right-width: 1px; border-top-color: #000000; border-top-style: solid; border-top-width: 1px; padding-bottom: 1pt; padding-left: 6pt; padding-right: 6pt; padding-top: 6pt; vertical-align: top;">
| |
| | |
| [[Image:Import_Data_icon.png|21x20px]]
| |
| | |
| | |
| </td>
| |
| <td style="border-bottom-color: #000000; border-bottom-style: solid; border-bottom-width: 1px; border-left-color: #000000; border-left-style: solid; border-left-width: 1px; border-right-color: #000000; border-right-style: solid; border-right-width: 1px; border-top-color: #000000; border-top-style: solid; border-top-width: 1px; padding-bottom: 1pt; padding-left: 6pt; padding-right: 6pt; padding-top: 6pt; vertical-align: top;">
| |
| Import Data icon - Opens the Import dialog box which you use to select a specific data file type for importing into Solo.
| |
| </td>
| |
| </tr>
| |
| <tr>
| |
| <td style="border-bottom-color: #000000; border-bottom-style: solid; border-bottom-width: 1px; border-left-color: #000000; border-left-style: solid; border-left-width: 1px; border-right-color: #000000; border-right-style: solid; border-right-width: 1px; border-top-color: #000000; border-top-style: solid; border-top-width: 1px; padding-bottom: 1pt; padding-left: 6pt; padding-right: 6pt; padding-top: 6pt; vertical-align: top;">
| |
| | |
| [[Image:Load_workspace_icon.png|20x18px]]
| |
| | |
| | |
| </td>
| |
| <td style="border-bottom-color: #000000; border-bottom-style: solid; border-bottom-width: 1px; border-left-color: #000000; border-left-style: solid; border-left-width: 1px; border-right-color: #000000; border-right-style: solid; border-right-width: 1px; border-top-color: #000000; border-top-style: solid; border-top-width: 1px; padding-bottom: 1pt; padding-left: 6pt; padding-right: 6pt; padding-top: 6pt; vertical-align: top;">
| |
| Load Workspace icon - Opens the Load Workspace dialog box from which you can select a .mat file to load into the Workspace Browser. (See [[WorkspaceBrowser_Layout#Save Workspace icon|Save Workspace icon]] below.)
| |
| </td>
| |
| </tr>
| |
| <tr>
| |
| <td style="border-bottom-color: #000000; border-bottom-style: solid; border-bottom-width: 1px; border-left-color: #000000; border-left-style: solid; border-left-width: 1px; border-right-color: #000000; border-right-style: solid; border-right-width: 1px; border-top-color: #000000; border-top-style: solid; border-top-width: 1px; padding-bottom: 1pt; padding-left: 6pt; padding-right: 6pt; padding-top: 6pt; vertical-align: top;">
| |
| | |
| [[Image:Save_Workspace_icon.png|20x18px]]
| |
| | |
| | |
| </td>
| |
| <td style="border-bottom-color: #000000; border-bottom-style: solid; border-bottom-width: 1px; border-left-color: #000000; border-left-style: solid; border-left-width: 1px; border-right-color: #000000; border-right-style: solid; border-right-width: 1px; border-top-color: #000000; border-top-style: solid; border-top-width: 1px; padding-bottom: 1pt; padding-left: 6pt; padding-right: 6pt; padding-top: 6pt; vertical-align: top;">
| |
| Save Workspace icon - Saves the currently loaded items to a single .mat file. You can save as many .mat files as needed to fit your working requirements, and then use the Load Workspace icon to load a saved .mat file into the base workspace.
| |
| </td> | |
| </tr>
| |
| </table>
| |
| | |
| ===Base Workspace===
| |
| | |
| The Workspace Browser shows the contents of the base workspace. The base workspace contains the shortcut icons for all of the Analysis tools. Some of these shortcut icons open the Analysis window in a specific analysis mode (for example, if you click Decompose (PCA), the Analysis window opens with PCA as the selected analysis mode) and some of these icons open specific windows (for example, if you click GA Variable selection, the Genetic Algorithm Variable Selection window opens). The base workspace also contains a Getting Started icon which launches the Eigenvector Research Documentation wiki, and a Choose Shortcuts icon, which opens the Select Shortcuts to Show dialog box. You can use the options in this dialog box to specify which shortcut icons are displayed in the base workspace for your Workspace Browser. (See [[WorkspaceBrowser_Preferences|Workspace Browser Preferences]].)
| |
| | |
| ::
| |
| ::
| |
Classification Information in Scores Plot
It is possible to view results of predicting classification of X-block samples in the Scores Plot when using analysis methods PLSDA, SVMDA, KNN or SIMCA.
These analysis methods determine the probability that a sample belongs to each of the possible classes.
Based on this the user can view plots showing the most probable class of each sample according to the model predictions. The "Plot Controls" window for the scores plot shows several classification fields among the choices of X or Y fields to plot. For example, setting the Plot Controls X field = "Sample" and the Y field = "Class Pred Most Probable" will show the most probable class for each sample in the Scores Plot.
In this "Class Pred Most Probable" case the Y axis ranges over class numbers and a sample belonging to class = 2 is shown at (x,y) = (sample number, 2). Points are drawn with distinct
symbols for each class and inserting a figure legend shows the class ID associated with each symbol.
There is always a most likely class for a sample to belong to but it is possible that the sample is not well modeled and has low
probabilities for all classes. Or it is possible that two classes are similar and a sample belonging to one of them will also
have a high predicted probability of belonging to the second class too. In these situations there can be little confidence in the "most probable"
class prediction. The choice labeled "Class Pred Strict" addresses these situations by assigning the sample to the "unknown" class (zero) if
the most likely class probability is less than 0.5 or if two or more classes have probability of greater than 0.5 for the sample.
The predicted probability that a sample belongs to a particular class, for example the class named <classID>, is available under the
label "Class Pred Probability <ClassID>". A sample belonging to this class will have value = 1, or 0 otherwise.
The label "Class Pred Member <ClassID>" identifies samples which have predicted probability > 0.5 of belonging to class "<ClassID>".
These samples will have value = 1, or 0 otherwise.
Note that label "Class Pred Member - unassigned" identifies samples which were not assigned to any class because no predicted probability
was greater than 0.5.
Finally, label "Misclassified" identifies samples where the predicted "Class Pred Strict" does not agree with the sample's actual class.
For SIMCA and PLSDA the actual class
could include more than one class and the sample is misclassified if its "Class Pred Member <ClassID>" do not correctly predict the actual class(es).
If the sample's actual class is unknown then the sample will not be identified as as misclassified.
Example of Classification Information in Scores Plot
Shown below is an example Scores Plot from PLSDA run on the arch dataset. In the Plot Controls window (on left) are shown some of the classification fields which may be plotted. The X field is set to "Sample" and the Y field is set to "Misclassified". The Scores Plot shows that all X samples have value 0 (NOT misclassified) except for one sample, the 16th, which has value 1, indicating it is misclassified. Looking at the "Class Pred Most Probable" field shows this sample is correctly predicted as belonging to class 2 ("BL"). Looking at "Class Member Pred K" and "Class Member Pred BL" both show sample 16 belonging, meaning that sample 16 belongs to each of these classes with probability > 0.5. Sample 16 actually only belongs to class "BL" as shown by Y="Class Measured 2 (BL)", and therefore it is considered to be misclassified.
Scores Plot (right) and its Plot Controls (left) for PLSDA on arch dataset.