Baseline correction with trendtool: Difference between revisions
Jump to navigation
Jump to search
imported>Scott (Created page with "===Baseline Corrected Area with TrendTool=== * Zoom into peak of interest, then select add marker and move the marker to the peak by left clicking and dragging. * Right click...") |
imported>Mathias |
||
| Line 7: | Line 7: | ||
* Drag the dashed lines to the desired points to use for two-point baseline correction. | * Drag the dashed lines to the desired points to use for two-point baseline correction. | ||
* Now take a look at the second figure. Because the dataset consisted of three spectra, the second figure plots the area under the curve and above the baseline for each spectra in the dataset. | * Now take a look at the second figure. Because the dataset consisted of three spectra, the second figure plots the area under the curve and above the baseline for each spectra in the dataset. | ||
<gallery caption="Fig. 2. Effect of varying ''cost'' parameter, with ''gamma'' = 0.01" widths="400px" heights="300px" perrow="2"> | |||
File:add_marker.jpg|a) ''cost = 0.1'' | |||
File:C1g0p01.png|b) ''cost = 1.0'' | |||
File:C10g0p01.png|c) ''cost = 10'' | |||
File:C100g0p01.png|d) ''cost = 100'' | |||
</gallery> | |||
Revision as of 13:24, 3 October 2016
Baseline Corrected Area with TrendTool
- Zoom into peak of interest, then select add marker and move the marker to the peak by left clicking and dragging.
- Right click the marker, and select area. A second marker will appear. Drag the two markers to the limits of the region of integration, in this case 1060 and 1100.
- Right click either of the markers and select add reference. A dashed line will appear.
- Right click the reference point, and select Baseline. A second dashed line will appear.
- Drag the dashed lines to the desired points to use for two-point baseline correction.
- Now take a look at the second figure. Because the dataset consisted of three spectra, the second figure plots the area under the curve and above the baseline for each spectra in the dataset.
- Fig. 2. Effect of varying cost parameter, with gamma = 0.01
- Add marker.jpg
a) cost = 0.1
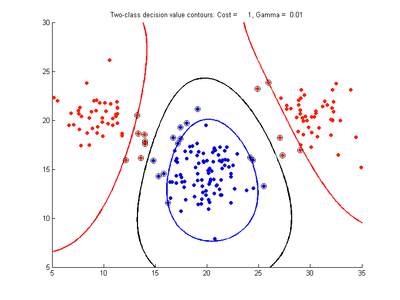
b) cost = 1.0
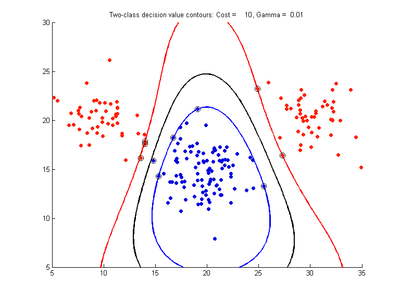
c) cost = 10
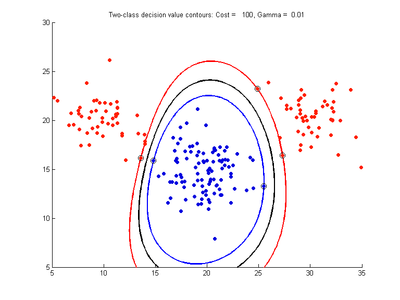
d) cost = 100


